The marketplace analytics stack: what happens after you adopt Snowflake and hire your first data person
Hi, this is Vivek, building Contextflo. I share practical notes on getting answers from your data, a couple of times a month.
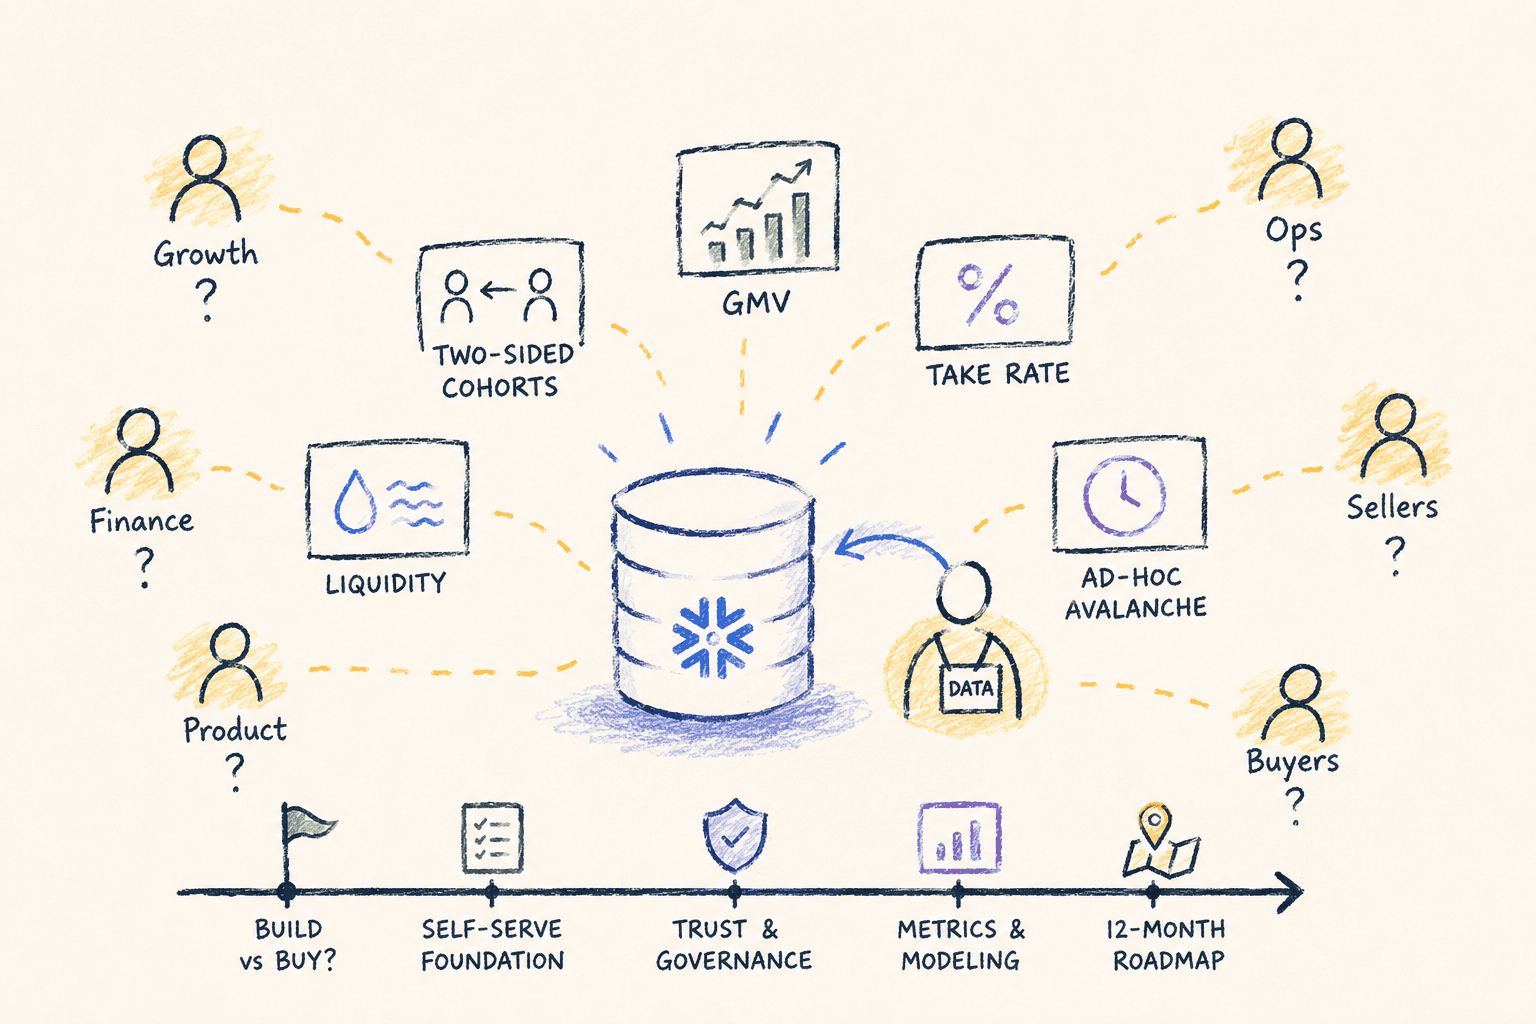
There is a specific moment in every marketplace's life. The operational database that ran everything gets a warehouse next to it, usually Snowflake. Someone gets hired with "data" in their title, usually one person. And everyone in the company simultaneously realises they have questions they have been sitting on for a year.
What happens next is predictable, because marketplaces generate more analytical questions per employee than almost any other business model. You have two sides, buyers and sellers, and every question comes in two flavours. You have liquidity dynamics nobody fully understands. You have take rates finance wants weekly and cohorts growth wants daily.
This is the roadmap I wish every marketplace had at that moment: which metrics actually matter, why the request volume explodes, and how to set up the first year so your one data person does not become a full-time ticket queue.
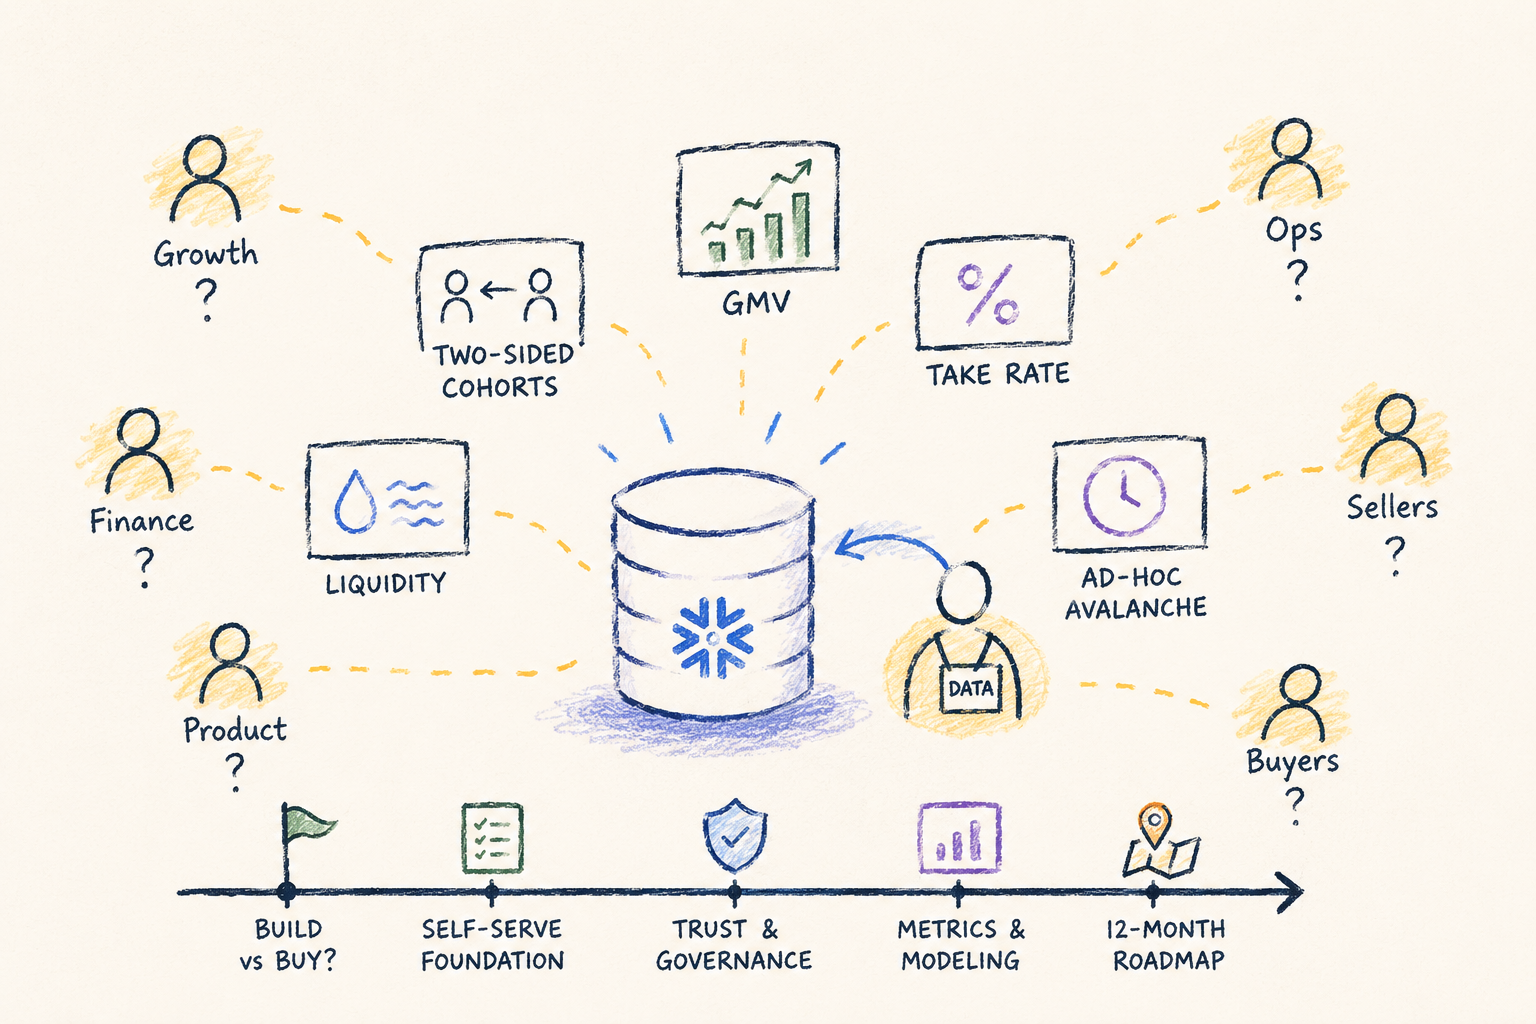
The marketplace metric set
Marketplaces have a canonical metric set, and half the early chaos comes from computing them inconsistently.
GMV (gross merchandise value). The headline number, and the most commonly miscalculated one. Does it include cancelled orders? Refunds? Taxes and shipping? Pick a definition, write it down, and make it the only definition anyone can query.
Take rate. Revenue divided by GMV. Trivial formula, but only if revenue and GMV are both defined consistently. If your fees vary by category or seller tier, expect "why did take rate dip" to be a weekly question.
Liquidity. The probability that a listing sells, or that a buyer finds what they want. This is the metric that actually predicts whether your marketplace works, and it is also the one that needs the most business context to compute: time windows, category normalisation, what counts as matched.
Two-sided cohorts. Buyer retention and seller retention are different curves with different drivers. Blending them into one retention number hides everything useful.
Cross-side effects. The questions that actually matter are joins across sides. Do buyers acquired in a seller-dense category retain better? Which sellers attract repeat buyers? These are not dashboard questions, they are investigations, and they are why the request queue never empties.
The ad-hoc avalanche, month by month
Months 1-2. The data person builds the core dashboards. GMV, orders, active buyers and sellers, take rate. Everyone is thrilled.
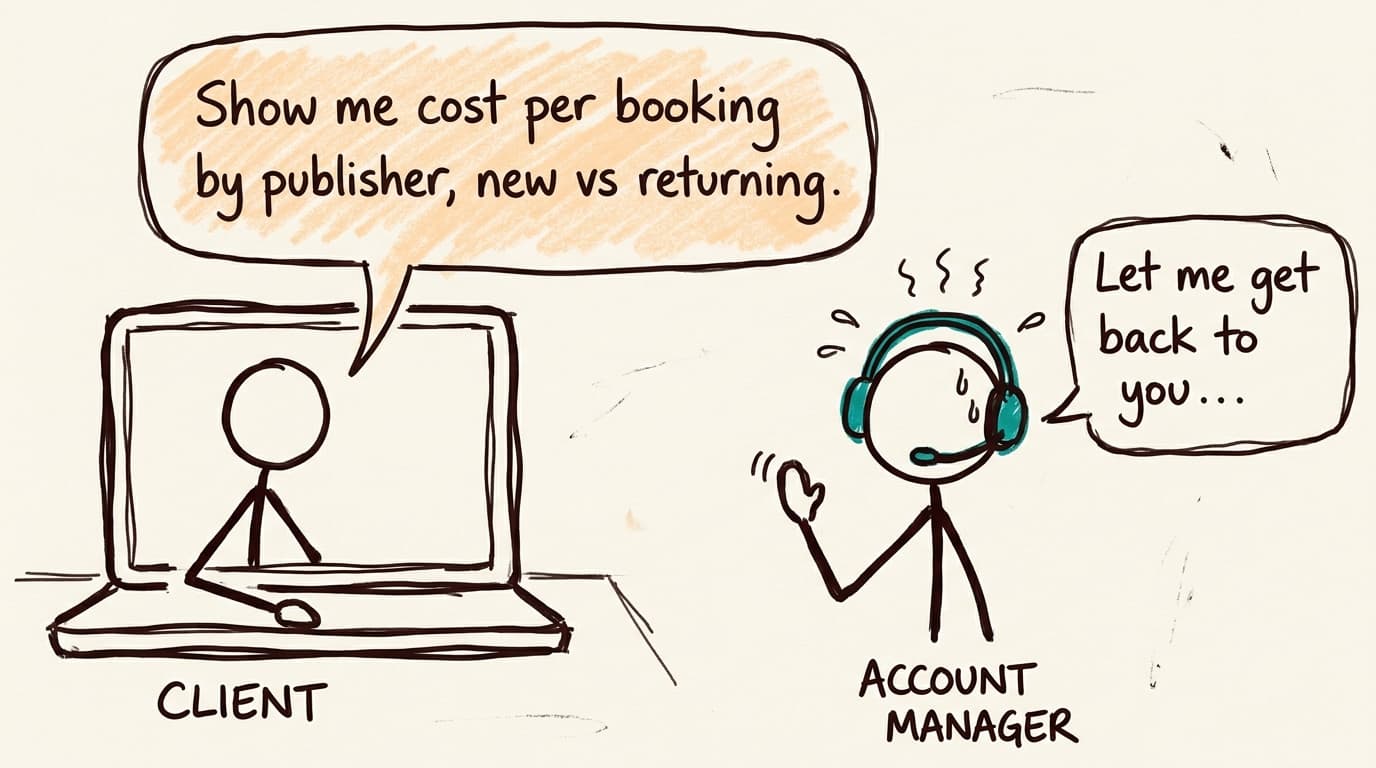
Months 3-4. The follow-up questions start. GMV dipped Tuesday, why? Can you break this down by seller tier? What did the coupon do to margins? Each is twenty minutes of SQL and there are five a day. The dashboards answer none of them, because dashboards answer recurring questions and these are investigations.
Months 5-6. The data person is now spending most of their time on requests. The actual roadmap, data models, pipeline reliability, the metrics layer, stalls. Ops and growth start pulling their own numbers from the operational database, which is how you get three versions of GMV in one meeting.
This is not a failure of the data person. It is the shape of the business: two-sided models generate compounding question volume, and one person is a fixed resource.
Build vs buy for self-serve
More dashboards. Does not work for investigation questions, and marketplace questions are disproportionately investigations. You cannot pre-build a dashboard for "why did liquidity drop in the Chicago vinyl category."
Give everyone warehouse access. Ops leads do not write SQL, and the ones who half-do produce the three-versions-of-GMV problem faster.
Build an internal AI layer. A quarter of your one data person's time to build, forever to maintain. You have re-created the problem.
A governed AI layer. Your team asks questions in plain English in Claude or ChatGPT. A context layer holds the metric definitions (one GMV, one take rate), scopes table access, and logs every query so the data person can audit what is being asked and where it goes wrong. The honest tradeoff: it costs money, and no tool invents your GMV definition for you. Someone still has to decide what counts, once.
Tilt, a live-auction marketplace running on Snowflake, is the version of this we know best: one data scientist, a team of about 60, and the full ad-hoc avalanche. Today most of the company self-serves through Claude with shared definitions and access controls, running around 6,000 queries a month. The data scientist's job went back to being analysis.
The 12-month roadmap for a one-person data team
If I were the first data hire at a marketplace today:
Quarter 1: definitions before dashboards. Write down GMV, take rate, and active buyer and seller definitions before building anything. Every future argument is cheaper to prevent than to settle.
Quarter 2: core dashboards for the recurring set. Weekly GMV, cohort curves, category breakdowns. Deliberately small, because every dashboard is a maintenance commitment.
Quarter 3: self-serve for the long tail. This is the avalanche quarter. Set up governed AI access with your definitions baked in, so investigation questions route around you instead of through you.
Quarter 4: the actual data work. Marketplace-specific models: liquidity scoring, seller health, matching quality. The work you were hired for, which is only reachable if quarters 1 to 3 got the question volume off your desk.
The trap is spending all four quarters in the month 3-6 loop. The way out is treating self-serve as infrastructure, not as a favour you do one Slack thread at a time.
Here is a more in-depth look at Contextflo and how it works.
What is Contextflo?
Contextflo is a governed context layer between your data and the AI your team already uses. Connect your warehouse once, and your team asks questions in their own Claude or ChatGPT. The model writes and runs the SQL; Contextflo supplies the definitions, the per-user access control, and the audit that make the answers trustworthy. Your data never moves, and you do not need a data team.
How it works
Your team queries in their own Claude or ChatGPT over MCP, so you bring any agent rather than a locked-in bot, and every answer comes back with the SQL shown and access enforced per user.
Find out if Contextflo is the right fit for you.
See how teams use Contextflo

Related posts

Keep reading
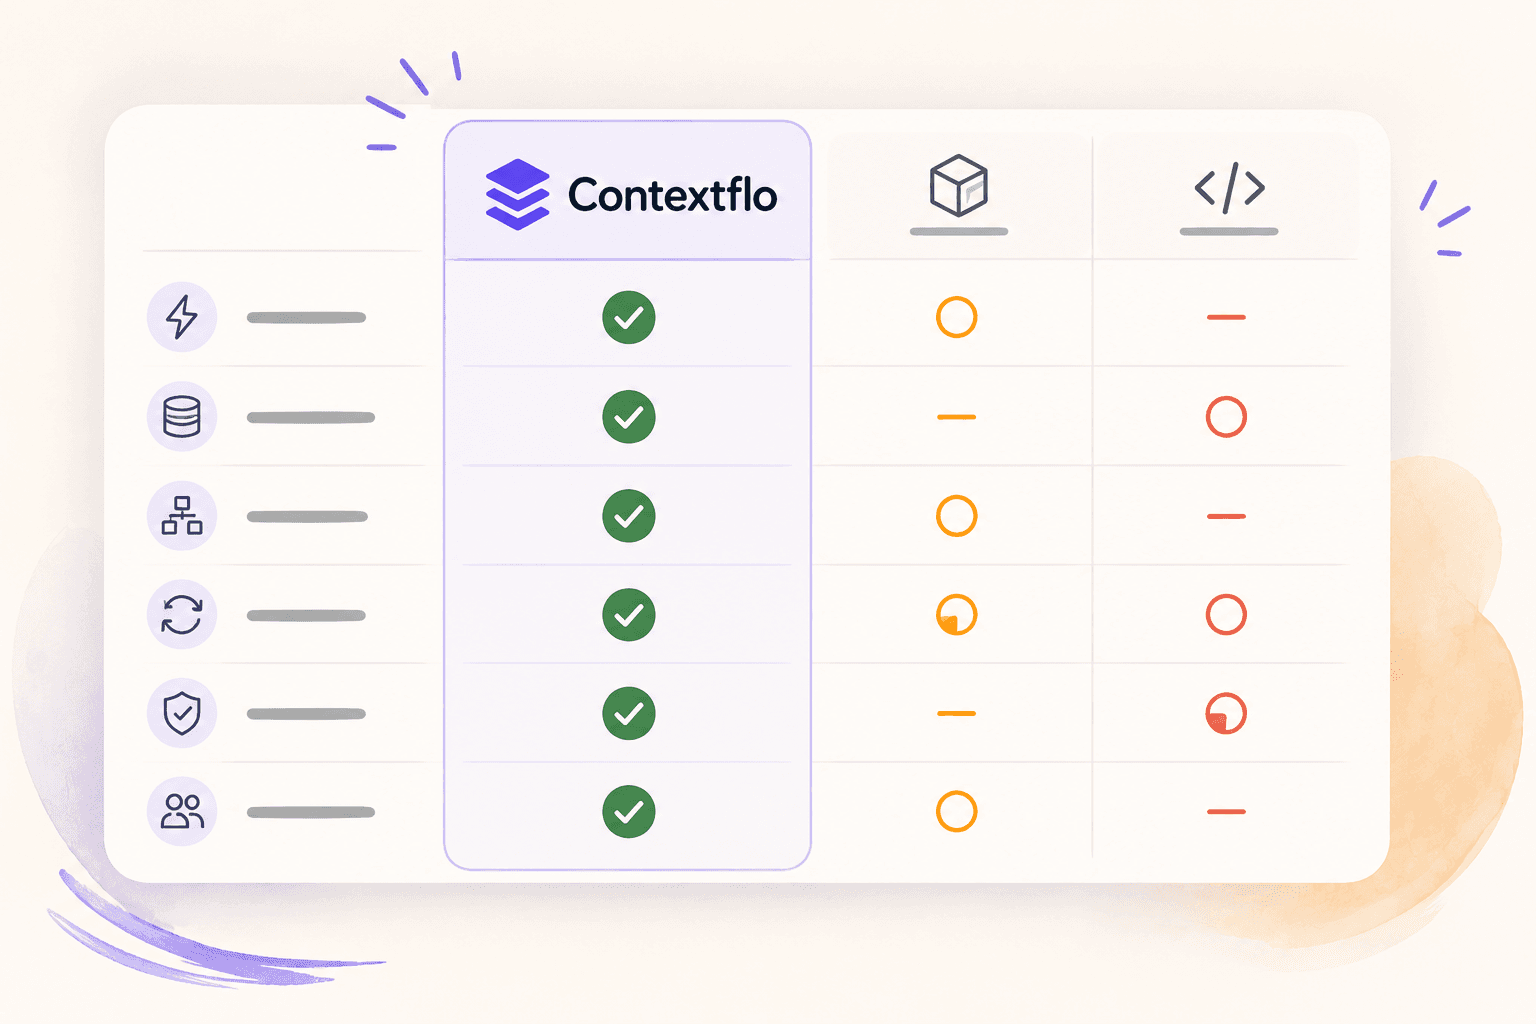
Conversational analytics: 5 ways to set it up, compared
7 min read
How to connect Claude to BigQuery? What works and what doesn't in 2026
8 min read
How to connect Claude to Postgres without giving it write access
7 min read

How to build a BI dashboard with Claude that your team can actually trust
8 min read

How to give Claude read-only access to your database (it isn't always the default)
7 min read
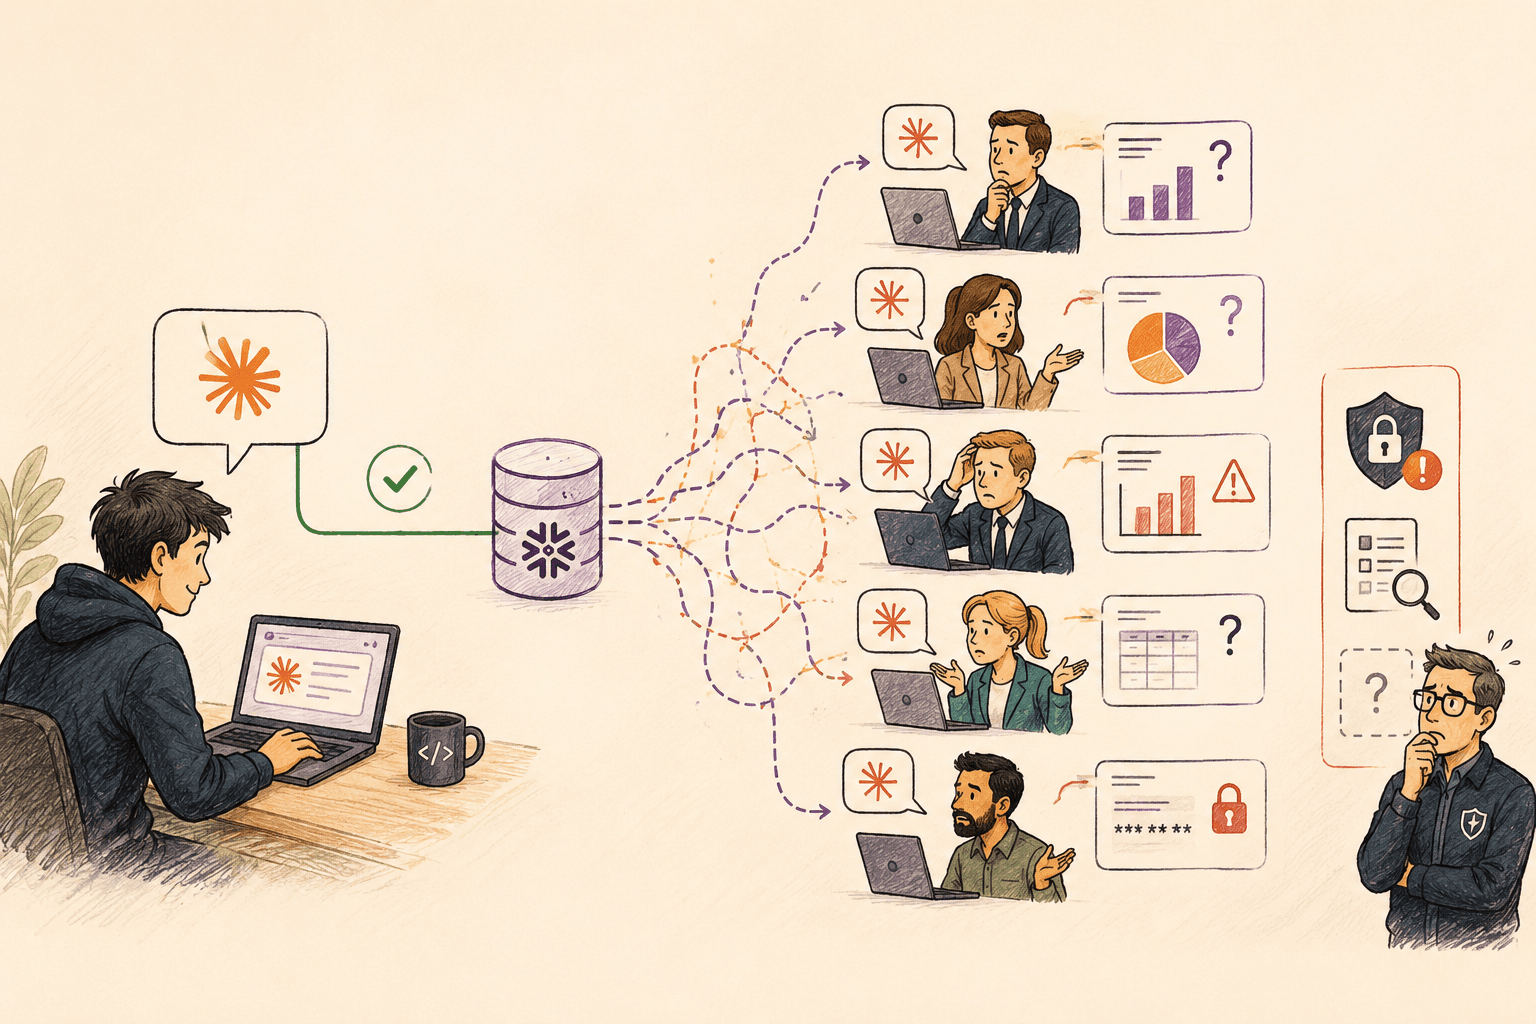
You connected your warehouse to Claude, now what?
5 min read
The official Postgres server for Claude is archived. Here's what to use instead.
7 min read
Still building the weekly KPI report by hand? How to automate it with Claude
7 min read

What should go in the board deck this month? How to pull metrics from HubSpot and Stripe with AI
7 min read