Does text-to-SQL need a semantic layer?
Hi, this is Vivek, building Contextflo. I share practical notes on getting answers from your data, a couple of times a month.
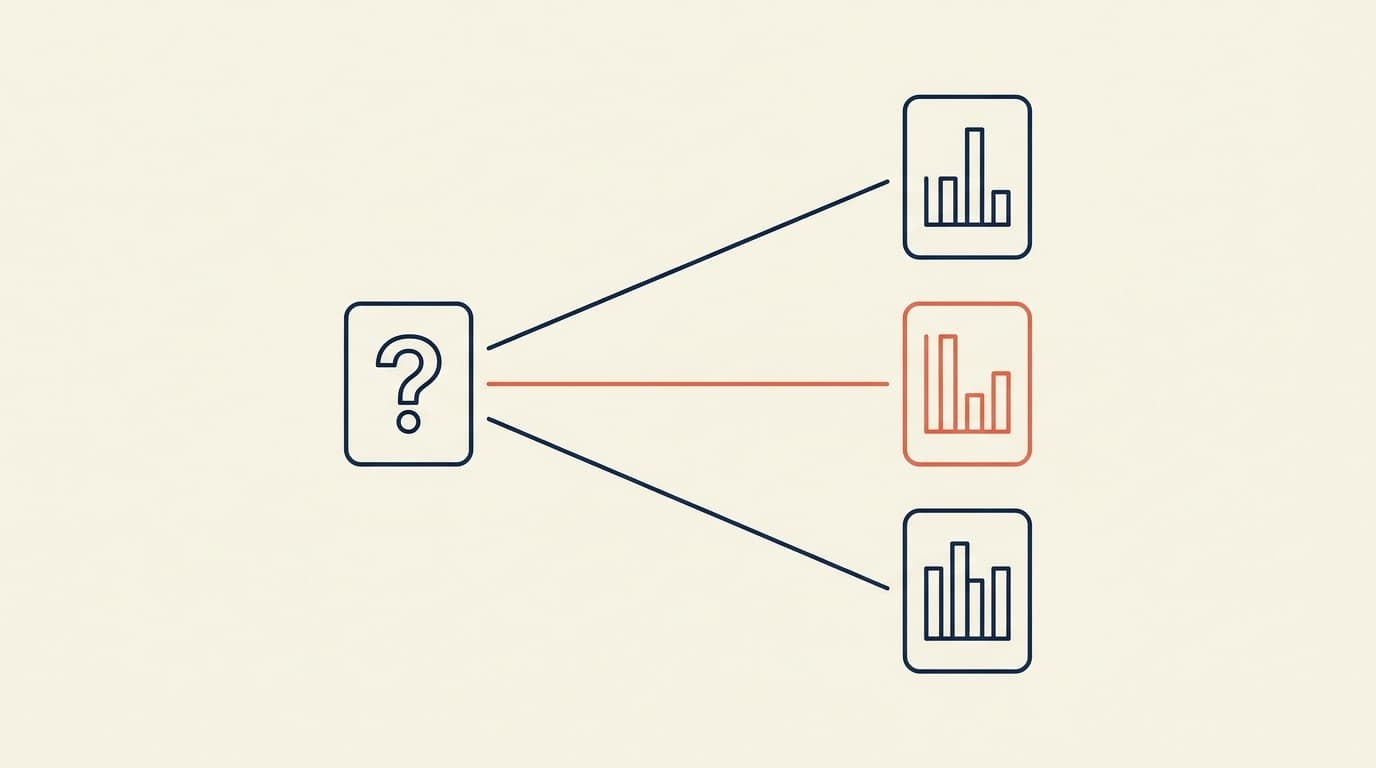
Text-to-SQL does not require a formal semantic layer to generate a query. It does require reliable semantic context once multiple people, recurring metrics, or business decisions depend on the answer.
If you want the plain definition before the text-to-SQL argument, start with What is a semantic layer?.
A founder running three projects on Supabase described the distinction neatly: the SQL was easy, while teaching the agent what everything meant was slow. Every session he had to re-explain which Stripe product mapped to which app, what "active user" meant, and which subscription states counted as revenue.
The AI was great at queries. It had no memory of his business.
That is what semantic context is for. A semantic layer is one way to store and serve it, but it does not have to begin as a large modeling project.
Why this got urgent
Semantic layers are not new. Looker had LookML. dbt has MetricFlow. Cube has been around for years. The difference is that the problem used to be contained to data teams building dashboards, and now everyone queries data through an AI tool, so "what does this column mean?" has spread to every team at once.
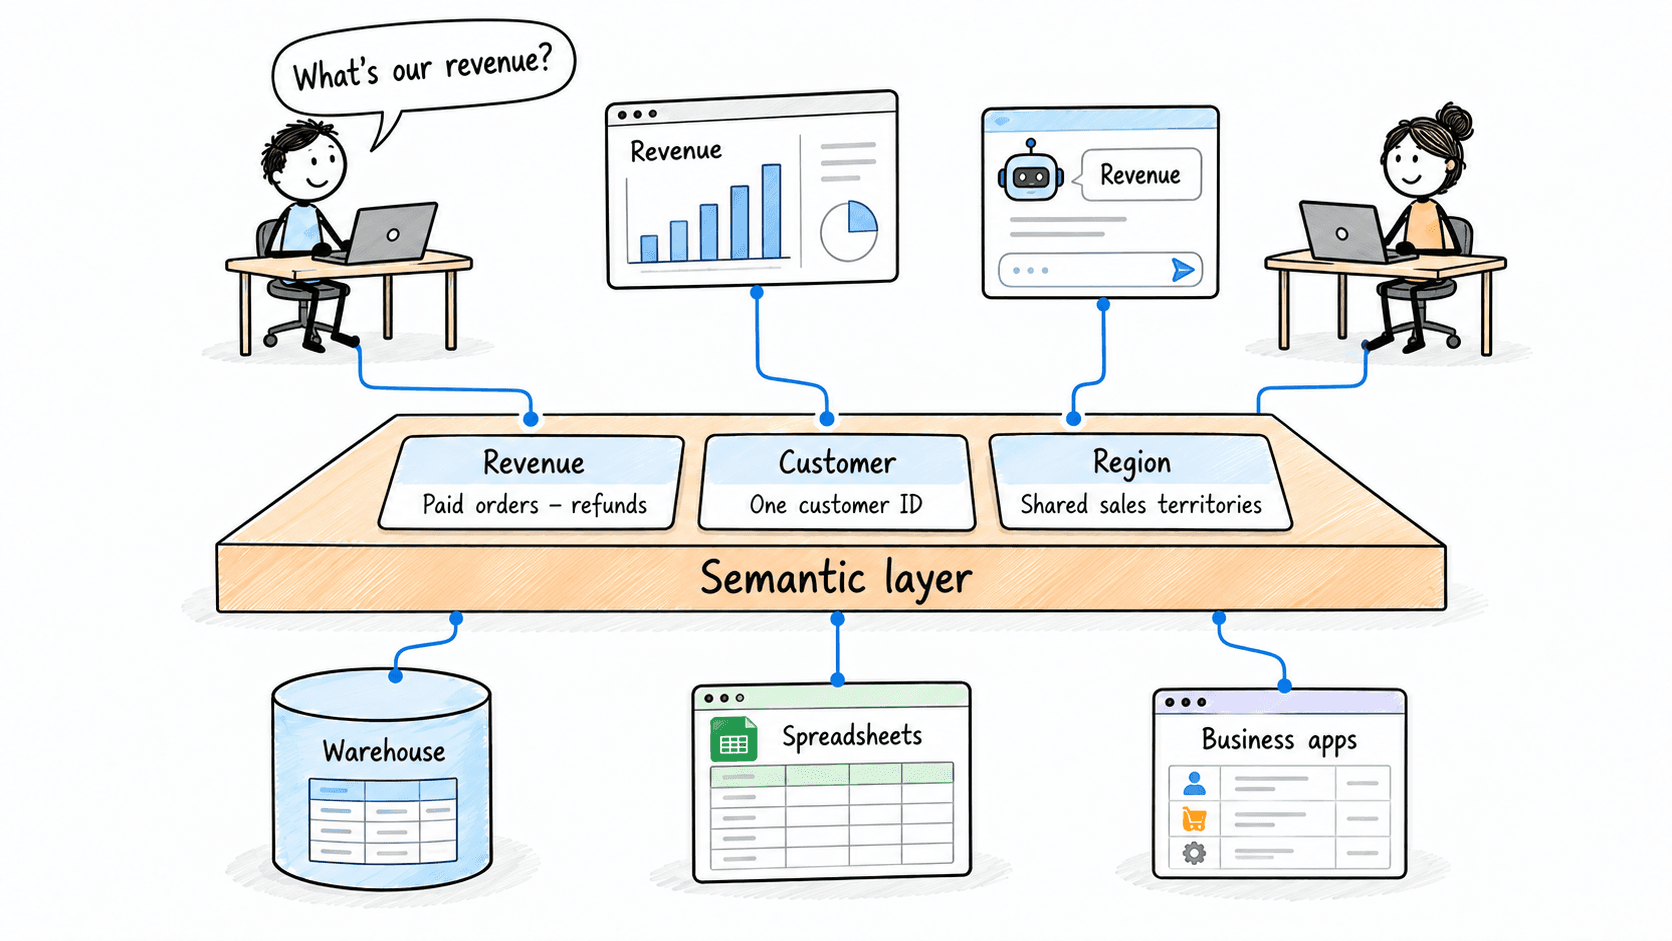
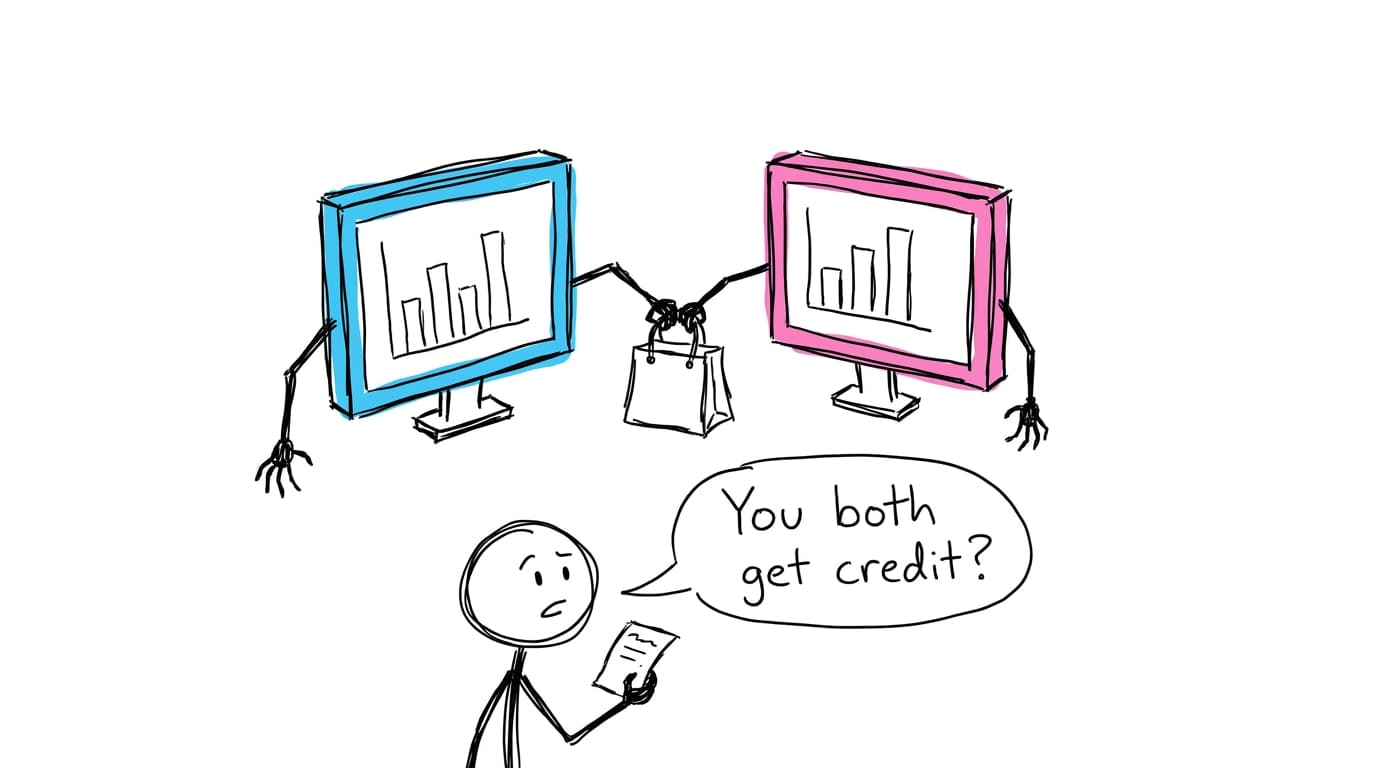
Without shared definitions, your dashboard says revenue is $1.2M, your analyst's export says $1.15M, and Claude says $1.3M. None of them is wrong. They are using different definitions of revenue, and nobody can tell which one they are looking at.
Your database stores raw data. It does not store what that data means. Revenue could be gross or net. Active user could mean logged in this week or completed an action. A semantic layer writes those decisions down once, so everything downstream agrees.
Five approaches people actually use
Talk to ten teams solving this and you will hear five answers. Here is what each looks like in practice, and where each one stops working.
1. Re-explain it every session
Paste your definitions into the chat or system prompt each time. This is where everyone starts. You tell Claude "revenue means sum of amount where status is completed, excluding refunds" and it gets it right. Tomorrow, you forget the refund clause and get a different number.
Works for one person. Breaks the moment a second person queries the data, because now there are two prompts with slightly different definitions and no way to tell them apart from the answers.
2. A markdown file the AI reads
One step up: write the definitions in a file and point your coding agent at it. "Here's metrics.md, read this before every query." Popular with developers using Cursor or Codex, and genuinely effective for a solo founder. If that is you, do this.
The limit is distribution and enforcement. Your ops lead asking questions in Claude's web interface does not automatically receive a local file. If the file is shared through a repository, someone still has to keep every consumer on the current version and enforce data access somewhere else.
3. Gold tables (the medallion approach)
Some teams skip the semantic layer and build curated tables instead. Raw goes to bronze, cleaned and joined goes to silver, then small specific tables that answer specific questions: gold. The AI only ever talks to gold tables, which are well-named, narrow, and hard to misread.
This works well if you have an engineer who will build and maintain the pipeline. The cost is that every new question needs a new gold table. You are back to the dashboard factory, except now you are manufacturing tables instead of charts.
4. Modeled semantic layers (Cube, dbt, LookML)
The modeled answer is to define metrics, dimensions, joins, and access rules in code or configuration. Cube exposes its governed model to dashboards, Analytics Chat, APIs, and AI agents over MCP. The dbt Semantic Layer defines metrics on top of dbt models and handles joins for downstream consumers. Looker Conversational Analytics grounds natural-language questions in LookML.
These systems can provide much more than definitions: query compilation, access policies, caching, lineage, and their own analysis interfaces. They are also a modeling project. Someone has to understand the schema and business logic, decide what is canonical, and maintain the model as the data changes.
For a company with an established analytics team, that rigor can be the point. For a small team where the founder is also the data person, the setup and maintenance may outweigh the benefit. The relevant choice is no longer “semantic layer or no semantic layer.” It is how much modeling and infrastructure your use case justifies.
5. A generated context layer
What if the layer built its own first draft? Connect the database, and the platform reads the schema: tables, columns, foreign keys, and types. It combines that with source code and docs to generate descriptions, relationships, and metric definitions. You review and correct rather than writing from an empty file.
That is the approach we took with Contextflo. The definitions are served as context to Claude, or any AI tool, whenever anyone on the team asks a question, so revenue means the same thing whether the CEO asks at 9am or the ops lead asks at 4pm.
The honest limit is the same one every generated artefact has: someone who knows the data still has to review the draft. Nothing in a schema records that orders before the 2024 migration use a different status vocabulary. Generation replaces the blank page; it does not replace the person who decides what the business means.
This distinction also appears in current text-to-SQL systems. Google's guidance lists business-specific examples, data linking, query history, and a semantic layer as complementary ways to supply context. An AWS reference architecture retrieves business context dynamically from a knowledge graph rather than requiring every question to stay inside a pre-modeled BI surface. The implementation varies; the need for business meaning does not.
The thing that actually changed
The most useful observation I have heard came from someone who lived through the previous wave of natural-language BI: Looker Ask, Tableau Ask Data, and Power BI Q&A. The LLM is not what is different.
What is different is that the agent can repair and extend its own context.
Those earlier tools only queried. Question in, SQL out, result back. If the result was wrong you started over, and the tool was exactly as wrong the next time. When a corrected definition can be saved back into a shared context layer, that correction applies to every future query for every user, and the loop is fundamentally different.
The old model: you author a dashboard once and ship it. Every new question needs a new dashboard.
The new model: definitions get renegotiated as people ask questions. Canonical metrics stay rigid; exploration stays flexible. Both coexist.
Worth being precise about one thing: the correction does not save itself. Someone has to decide that "revenue excludes refunds" is the canonical definition and write it down. The system makes that a one-line action rather than a config PR, but it is still a human deciding. A tool that silently learned from every correction would be a tool that learns from every mistake too.
Which one fits you
Solo founder, one project. A markdown file is fine. Write the definitions, point your agent at it, move on.
Small team, several people querying. You need shared definitions and access control, and a markdown file distributes to nobody. This is where a generated context layer saves you weeks of YAML.
Data team with BI tools. Cube or dbt Semantic Layer. You have the people, and you need the Tableau, Looker or Hex integrations.
Embedded analytics in your product. Cube's API layer with caching is built for exactly this. If you are serving dashboards to customers at scale, that is the right tool and it is not close.
You do not need a formal semantic layer to try text-to-SQL. You need shared, governed semantic context when the same question must mean the same thing across people and tools. The practical decision is how much infrastructure you are willing to take on to provide it.
If you want to make that concrete before choosing any infrastructure, build the smallest useful semantic layer in 20 minutes with a CSV, a few metric definitions, and a Claude Project.
Frequently asked questions
Does text-to-SQL require a semantic layer?
No. A model can generate SQL from table and column names alone. But once people rely on the answers, it needs shared semantic context such as metric definitions, join paths, business terms, verified queries, and access rules. A formal semantic layer is one way to provide that context, not the only way.
What is the difference between a semantic layer and semantic context?
Semantic context is the business meaning an AI needs to write the right query. A semantic layer is a system that stores, serves, and often enforces that meaning. A markdown file can provide semantic context for one person; a shared layer becomes useful when several people and tools need consistent definitions.
When can I use text-to-SQL without a semantic layer?
It can be enough for exploration by one technical user working with a small, well-named schema who checks every query. Add a shared layer when multiple users, recurring metrics, sensitive data, or business decisions depend on consistent answers.
Try it
Contextflo connects to Postgres, BigQuery, Snowflake, ClickHouse, Redshift and Databricks. Setup takes about 10 minutes. No YAML and no up-front modeling project: the context works on day one and sharpens as your team saves corrections.
Here is a more in-depth look at Contextflo and how it works.
What is Contextflo?
Contextflo is a governed context layer between your data and the AI your team already uses. Connect your warehouse once, and your team asks questions in their own Claude or ChatGPT. The model writes and runs the SQL; Contextflo supplies the definitions, the per-user access control, and the audit that make the answers trustworthy. Your data never moves, and you do not need a data team.
How it works
Your team queries in their own Claude or ChatGPT over MCP, so you bring any agent rather than a locked-in bot, and every answer comes back with the SQL shown and access enforced per user.
Find out if Contextflo is the right fit for you.
See how teams use Contextflo


Related posts


Keep reading
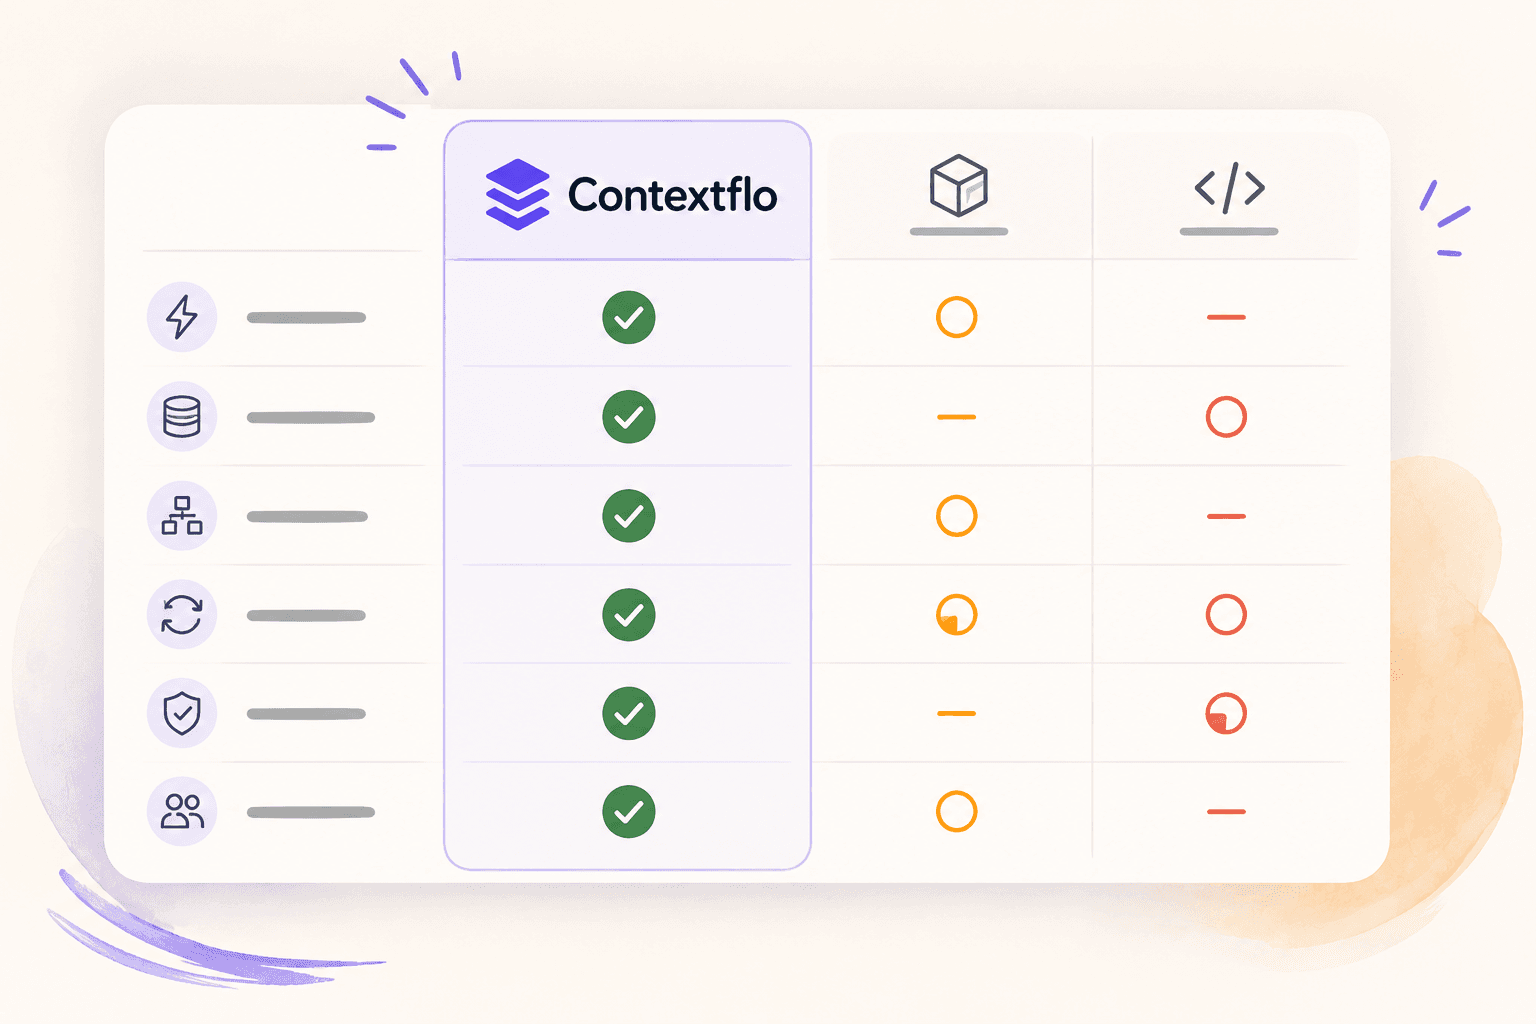
Conversational analytics: 5 ways to set it up, compared
7 min read
How to connect Claude to BigQuery? What works and what doesn't in 2026
8 min read
How to connect Claude to Postgres without giving it write access
7 min read

How to build a BI dashboard with Claude that your team can actually trust
8 min read
How to give Claude read-only access to your database (it isn't always the default)
7 min read

You connected your warehouse to Claude, now what?
5 min read
The official Postgres server for Claude is archived. Here's what to use instead.
7 min read
Why is the team missing sprint goals? How to analyze Jira data with AI
8 min read
Are my ads actually profitable? How to analyze Facebook and TikTok ads together with AI
7 min read