How to build a BI dashboard with Claude that your team can actually trust
Someone on your team wired Claude to your data, asked for a dashboard, and got one back in a couple of minutes. It looked great. Then they shared it, and in the next meeting someone pointed at a number and asked "is that right?" and the room went quiet. Nobody could say.
That gap, between a dashboard that looks finished and one people will make decisions on, is the whole problem. Building it is easy now. Whether anyone can trust it depends on the setup underneath.
Four ways people build Claude dashboards
Most teams that try this land in one of four setups. They look similar in a screenshot. They behave very differently a week later, when someone else opens the dashboard and asks where a number came from.
| Setup | Live? | Shared definitions? | Can you check the SQL? | Who controls access? |
|---|---|---|---|---|
| 1. Static dashboard in the chat | No | No | No | Only you, in that chat |
| 2. Live artifact in Cowork | Yes | No | No | The creator's workspace |
| 3. Live artifact with a context layer | Yes | Yes | Partly | The creator's workspace |
| 4. Published to one governed place, SQL visible | Yes | Yes | Yes | Enforced at query time |
The rest of this post takes them in order, and then shows how to skip straight to the last one.
1: A static dashboard in the chat
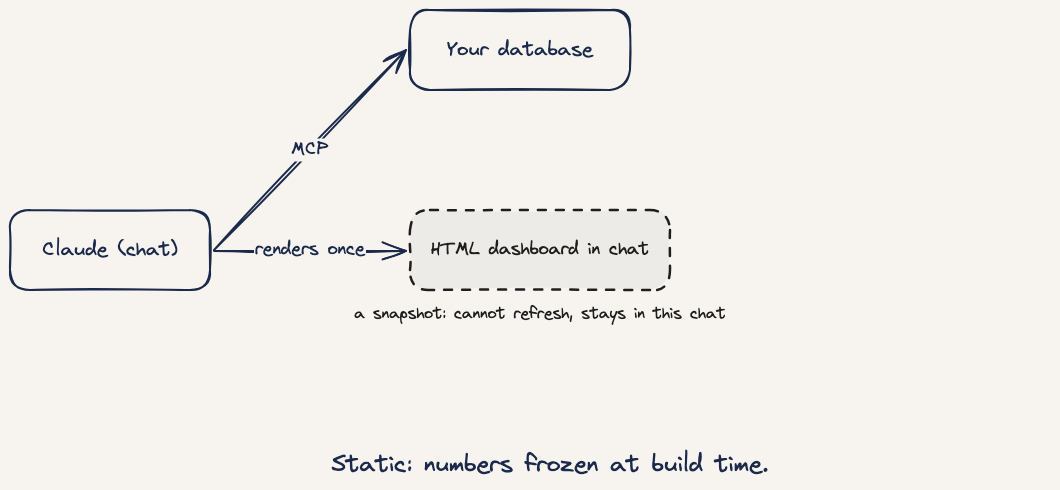
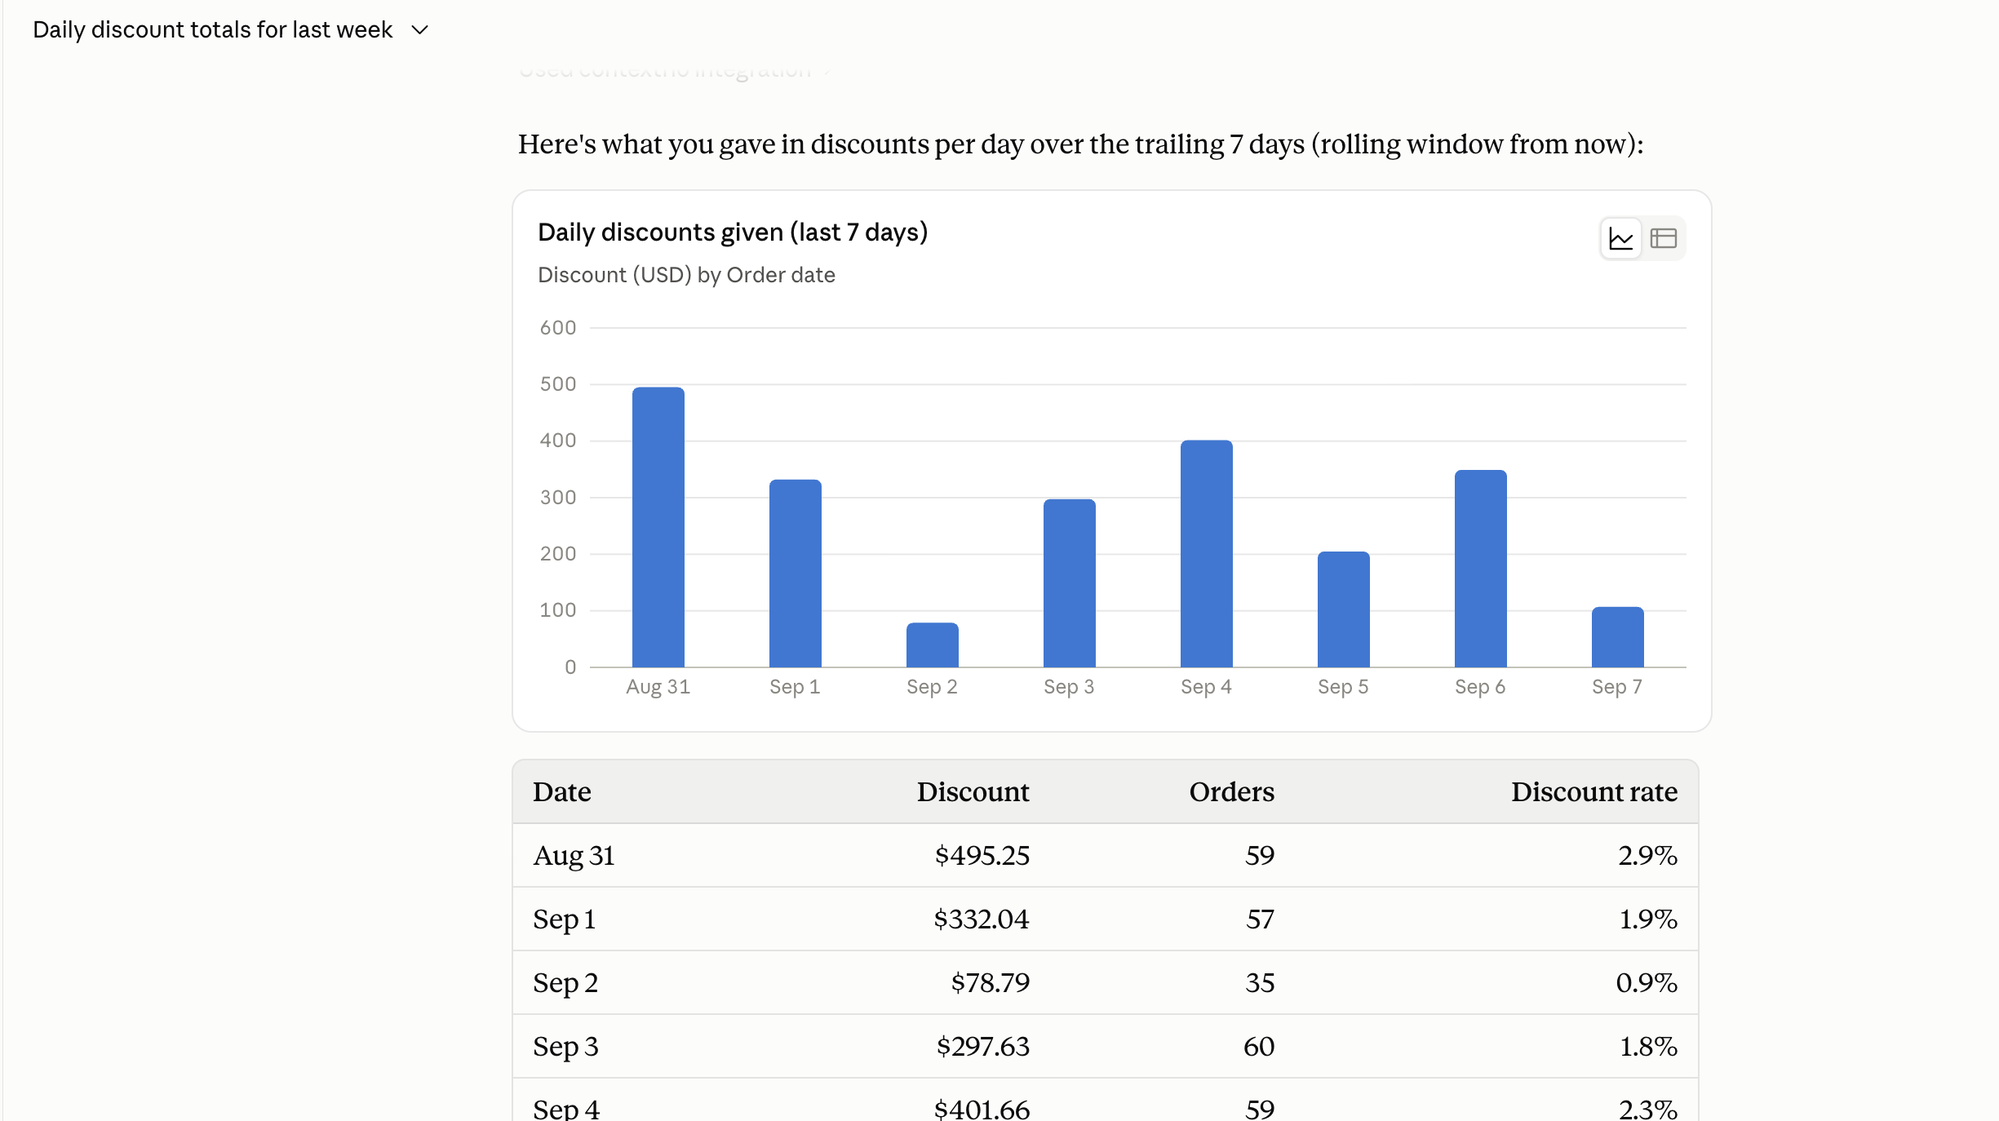
This is the version every demo shows. Connect Claude to your database over MCP, ask for "a weekly view of orders, revenue, and new customers by region," and Claude writes the SQL, runs it, and renders an HTML dashboard right in the conversation.
Pros:
- Fastest path from question to chart. One sentence, a minute, nothing to learn.
- Exactly right for a one-off question you will not ask again.
Cons:
- Frozen at build time. The chart is tied to the conversation, not to the data, so it cannot refresh.
- It does not leave the chat. To show anyone, you screenshot it, and now the screenshot is the dashboard.
2: A live artifact in Cowork
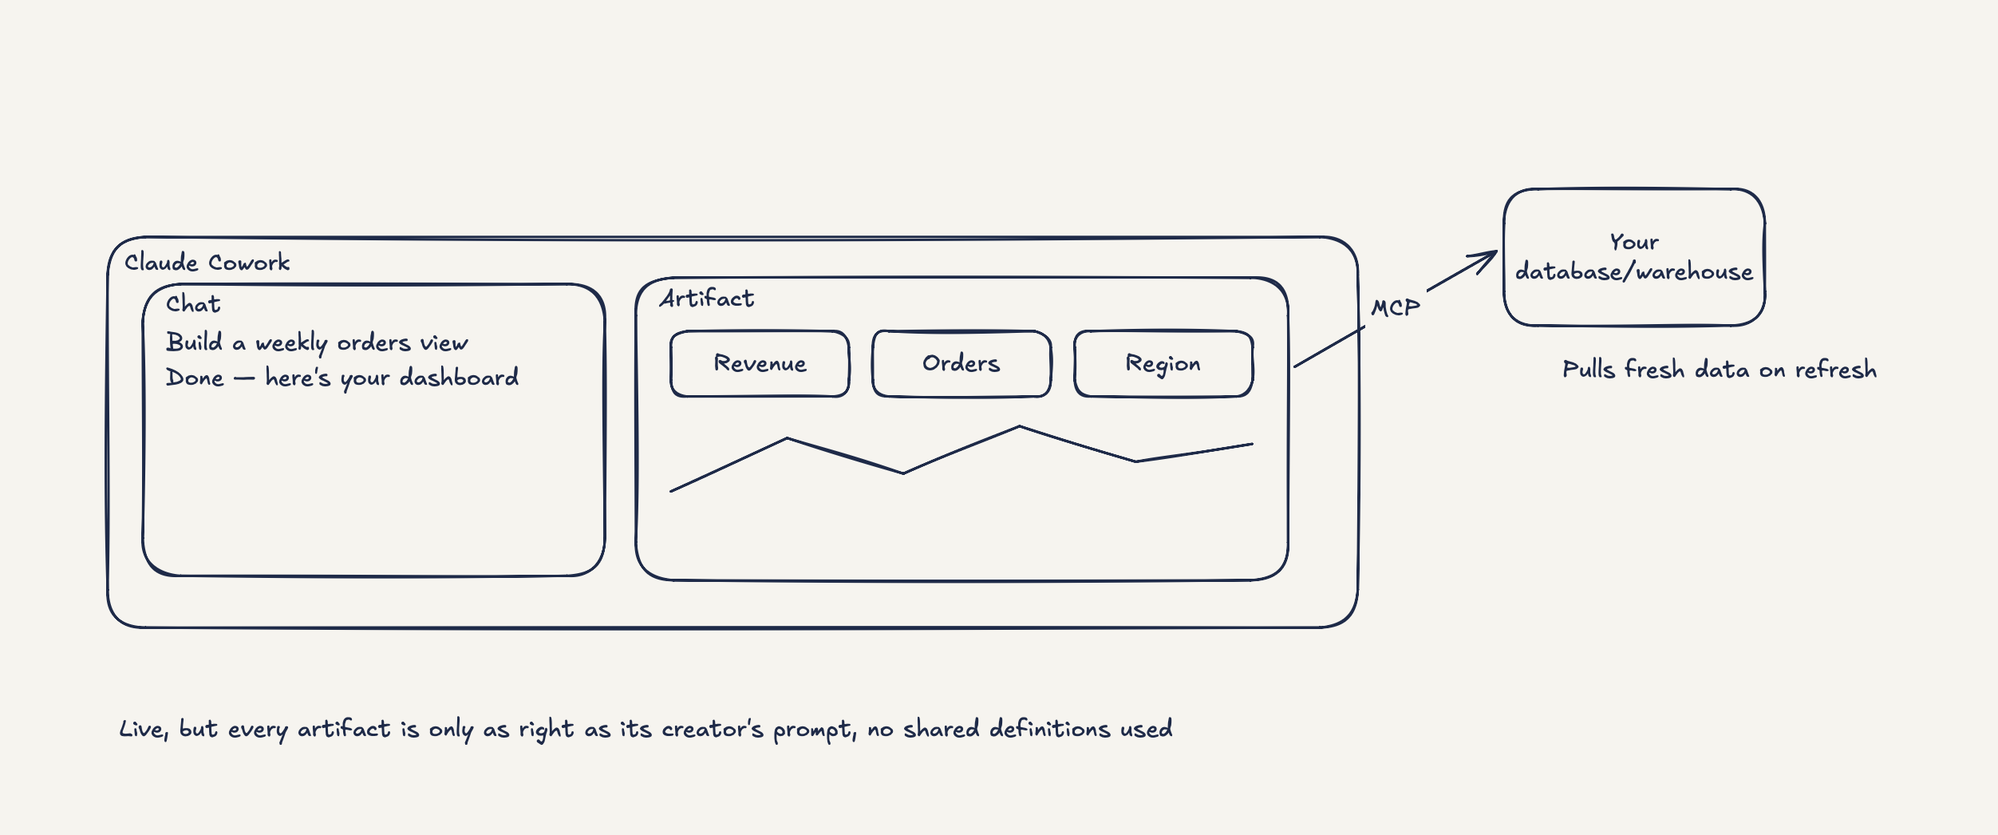
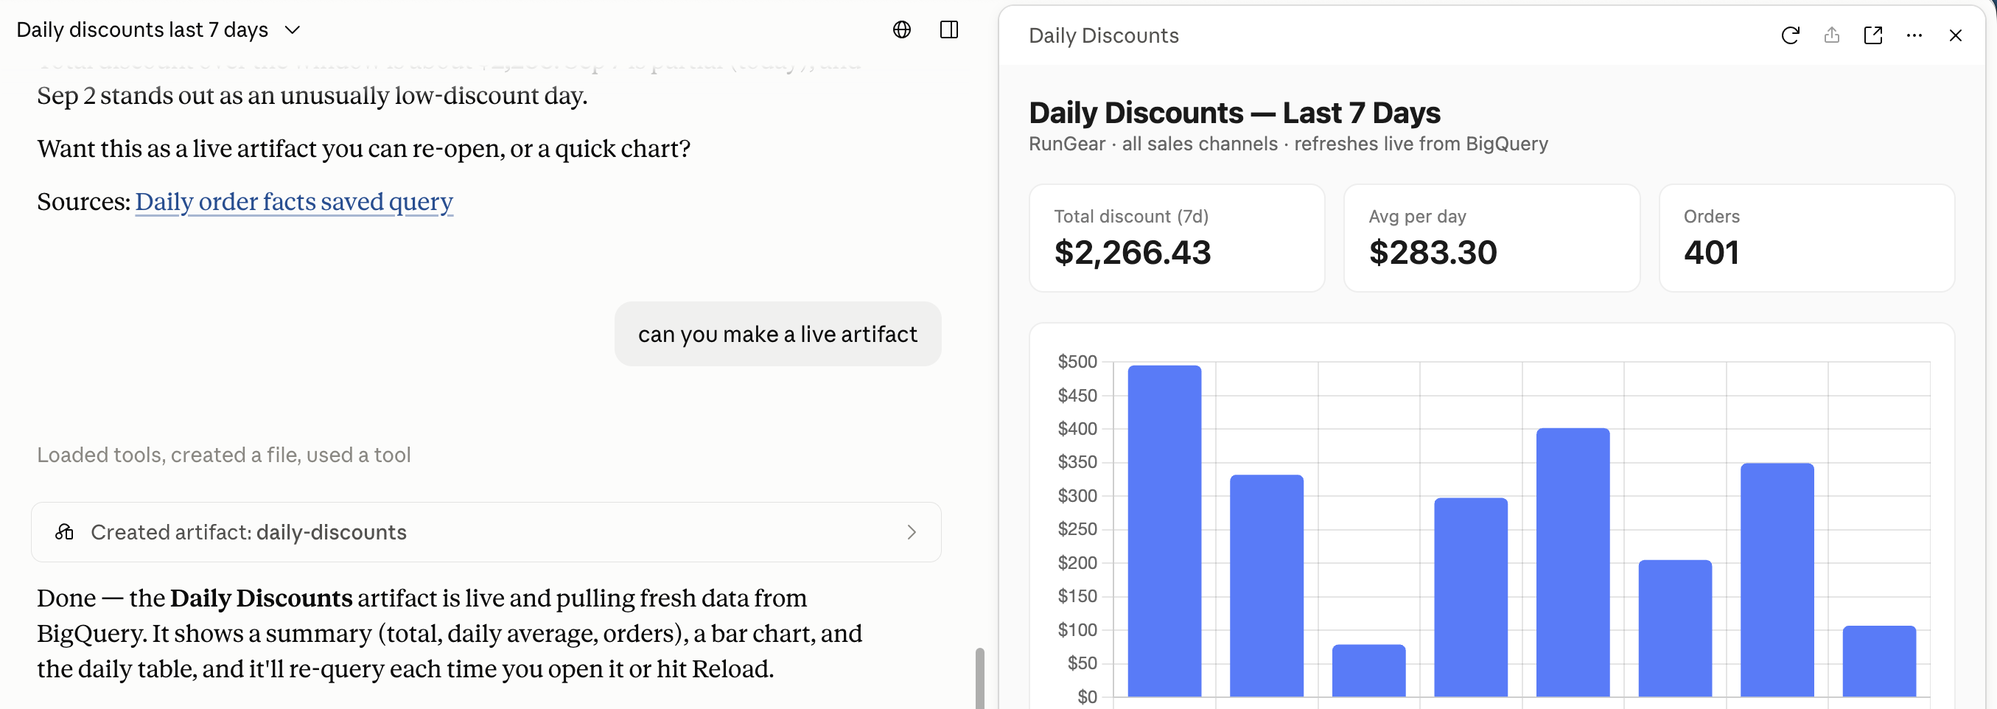
Claude's live artifacts fix the freshness problem. Build the dashboard in Cowork with Claude connected to your data, and the artifact re-runs its queries every time it is opened, so the numbers are always current.
Pros:
- Live. Every open re-runs the queries against your warehouse, so the numbers are today's.
- Still one sentence to build, and you can come back to it.
Cons:
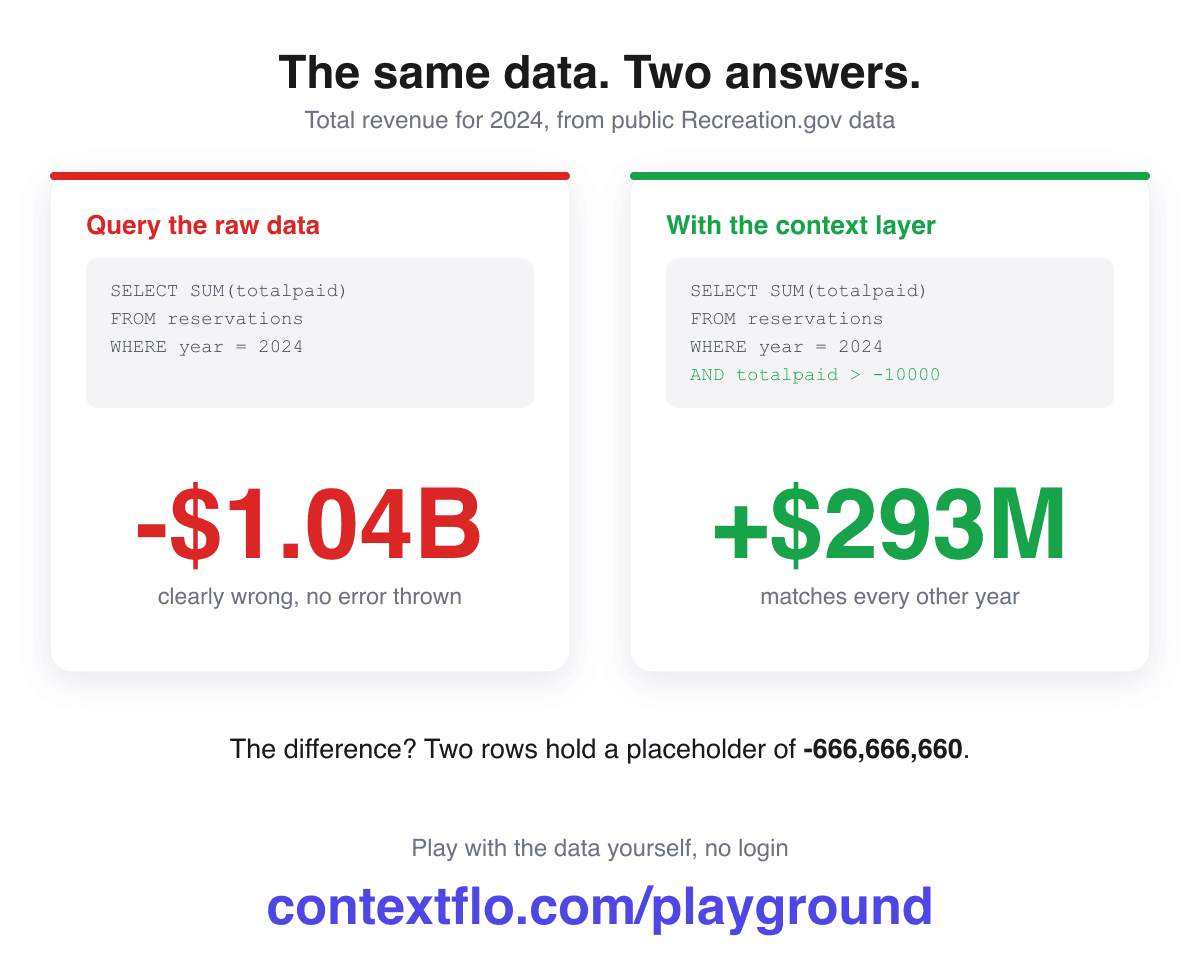
- Only you know what it represents. The model inferred what "revenue" meant and which rows count as an order when it built the artifact. A wrong guess that lands on a real column returns a plausible number, not an error, and two people asking the same question get two different numbers.
- No receipt. There is no SQL to open, so every artifact asks the viewer to trust that whoever built it understood the data.
- No boundary either. Whoever can open it runs against everything the creator could see.
For a personal exploration, none of this matters. For a dashboard three teams rely on, it is what destroys trust.
3: A live artifact with a context layer underneath
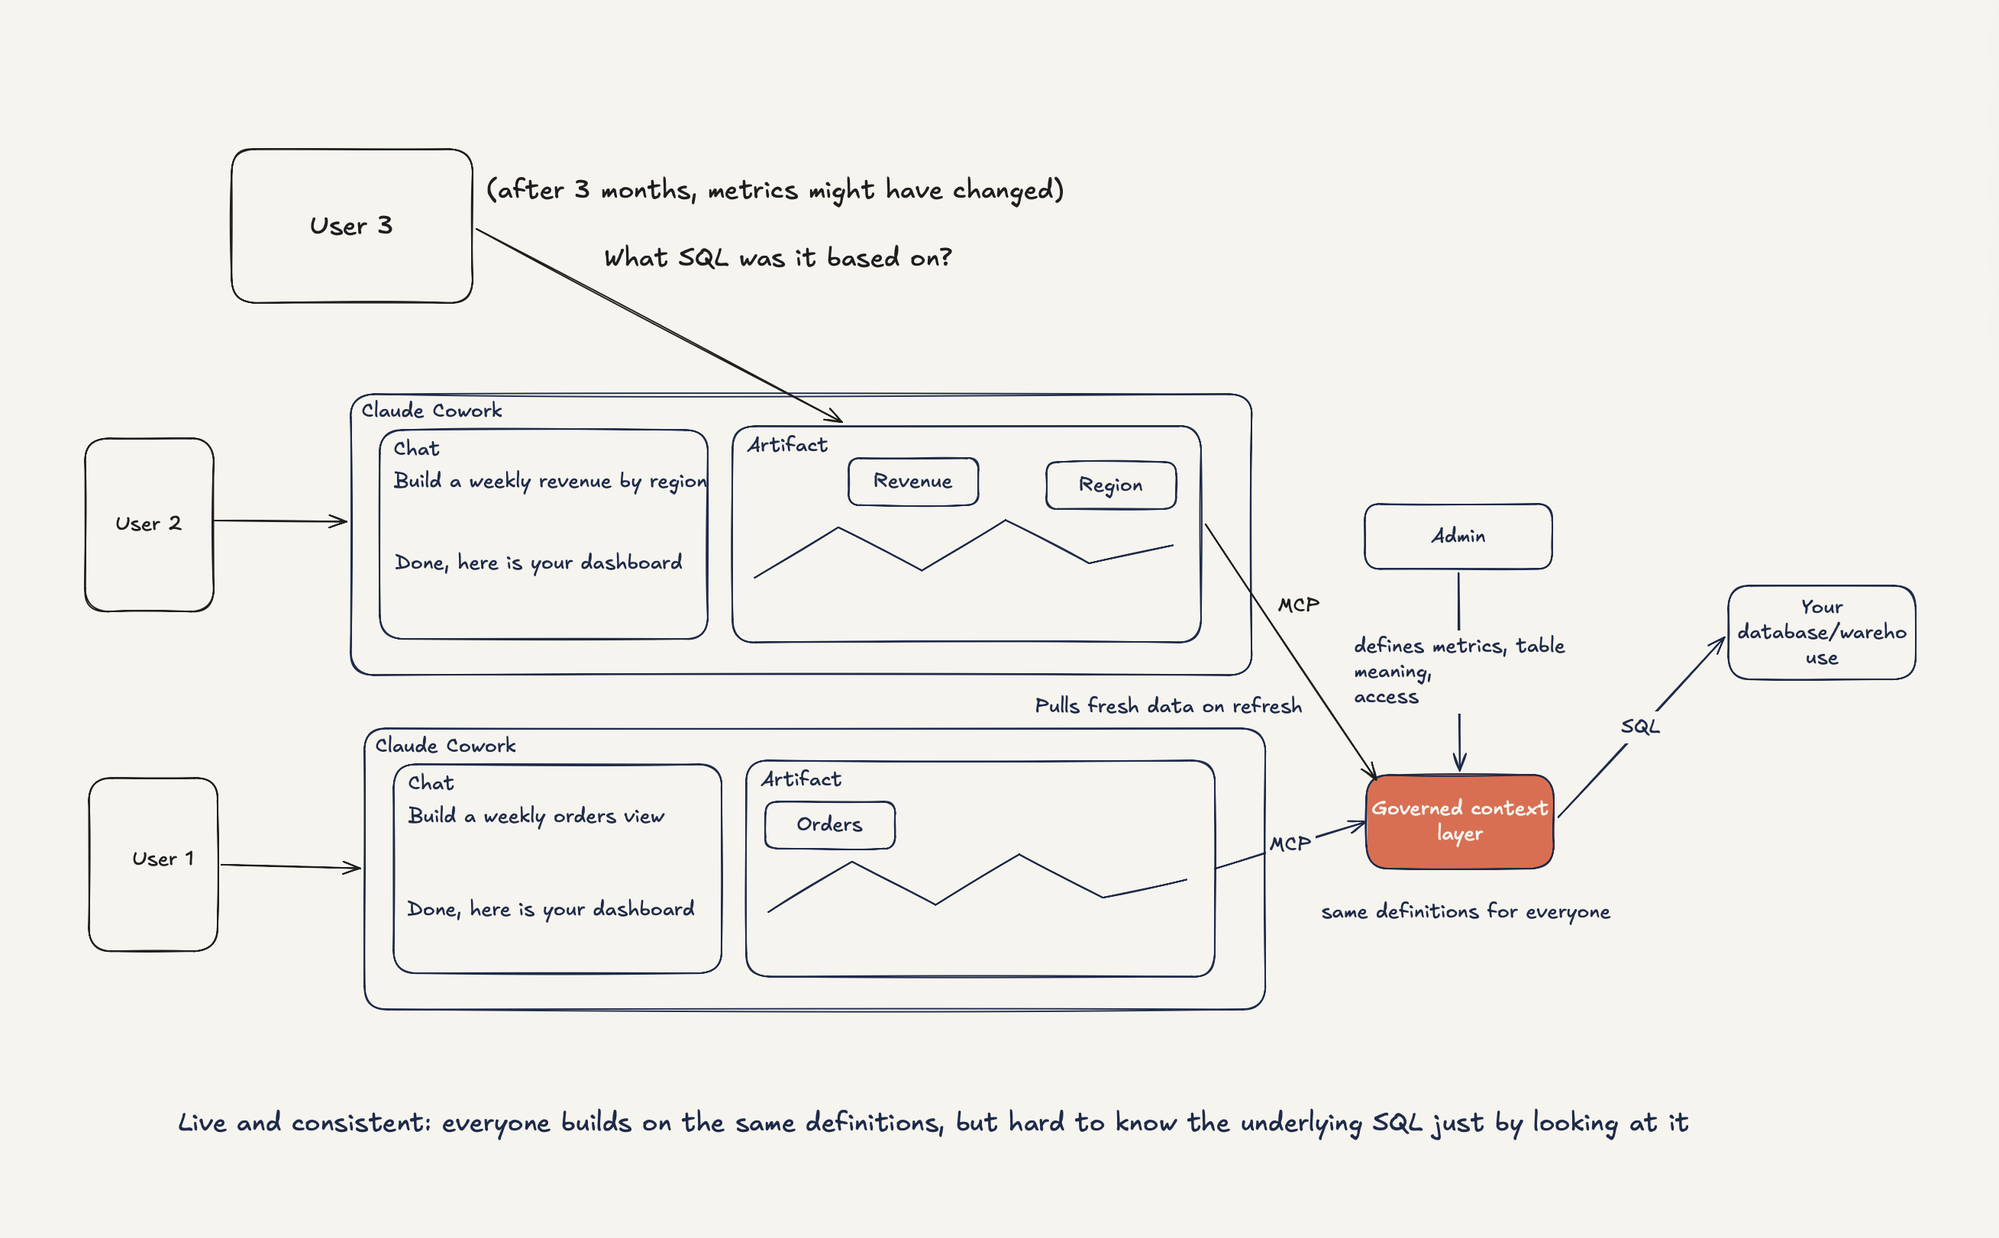
The next step is to stop the model guessing. Put a context layer between Claude and the database: a place where someone who knows the data writes down, once, what each table holds and what each metric means. Claude reads that context over MCP before it writes SQL.
Pros:
- Shared definitions. What counts as "revenue" and what counts as an "order" is written down once by someone who knows the data. User 1's weekly orders view and User 2's revenue by region now count the same things, whoever asks and however they phrase it.
- Setup is an admin job done once. Building is anyone's job, in plain language. That split is what scales past the one person who understands the warehouse.
Cons:
- Metrics change. Three months later "revenue" excludes refunds and it did not before, and a dashboard built on the old definition may be wrong without anyone noticing. Worse, you cannot see the SQL it was built on, so there is no way to tell whether it is still right by looking at it.
- Versions pile up. One person ends up with two or three near-identical dashboards across their own sessions, and nobody knows which one is canonical. That needs a central place, and it is the one thing classic BI tools did well.
4: The same artifact, published to one governed place with the SQL visible
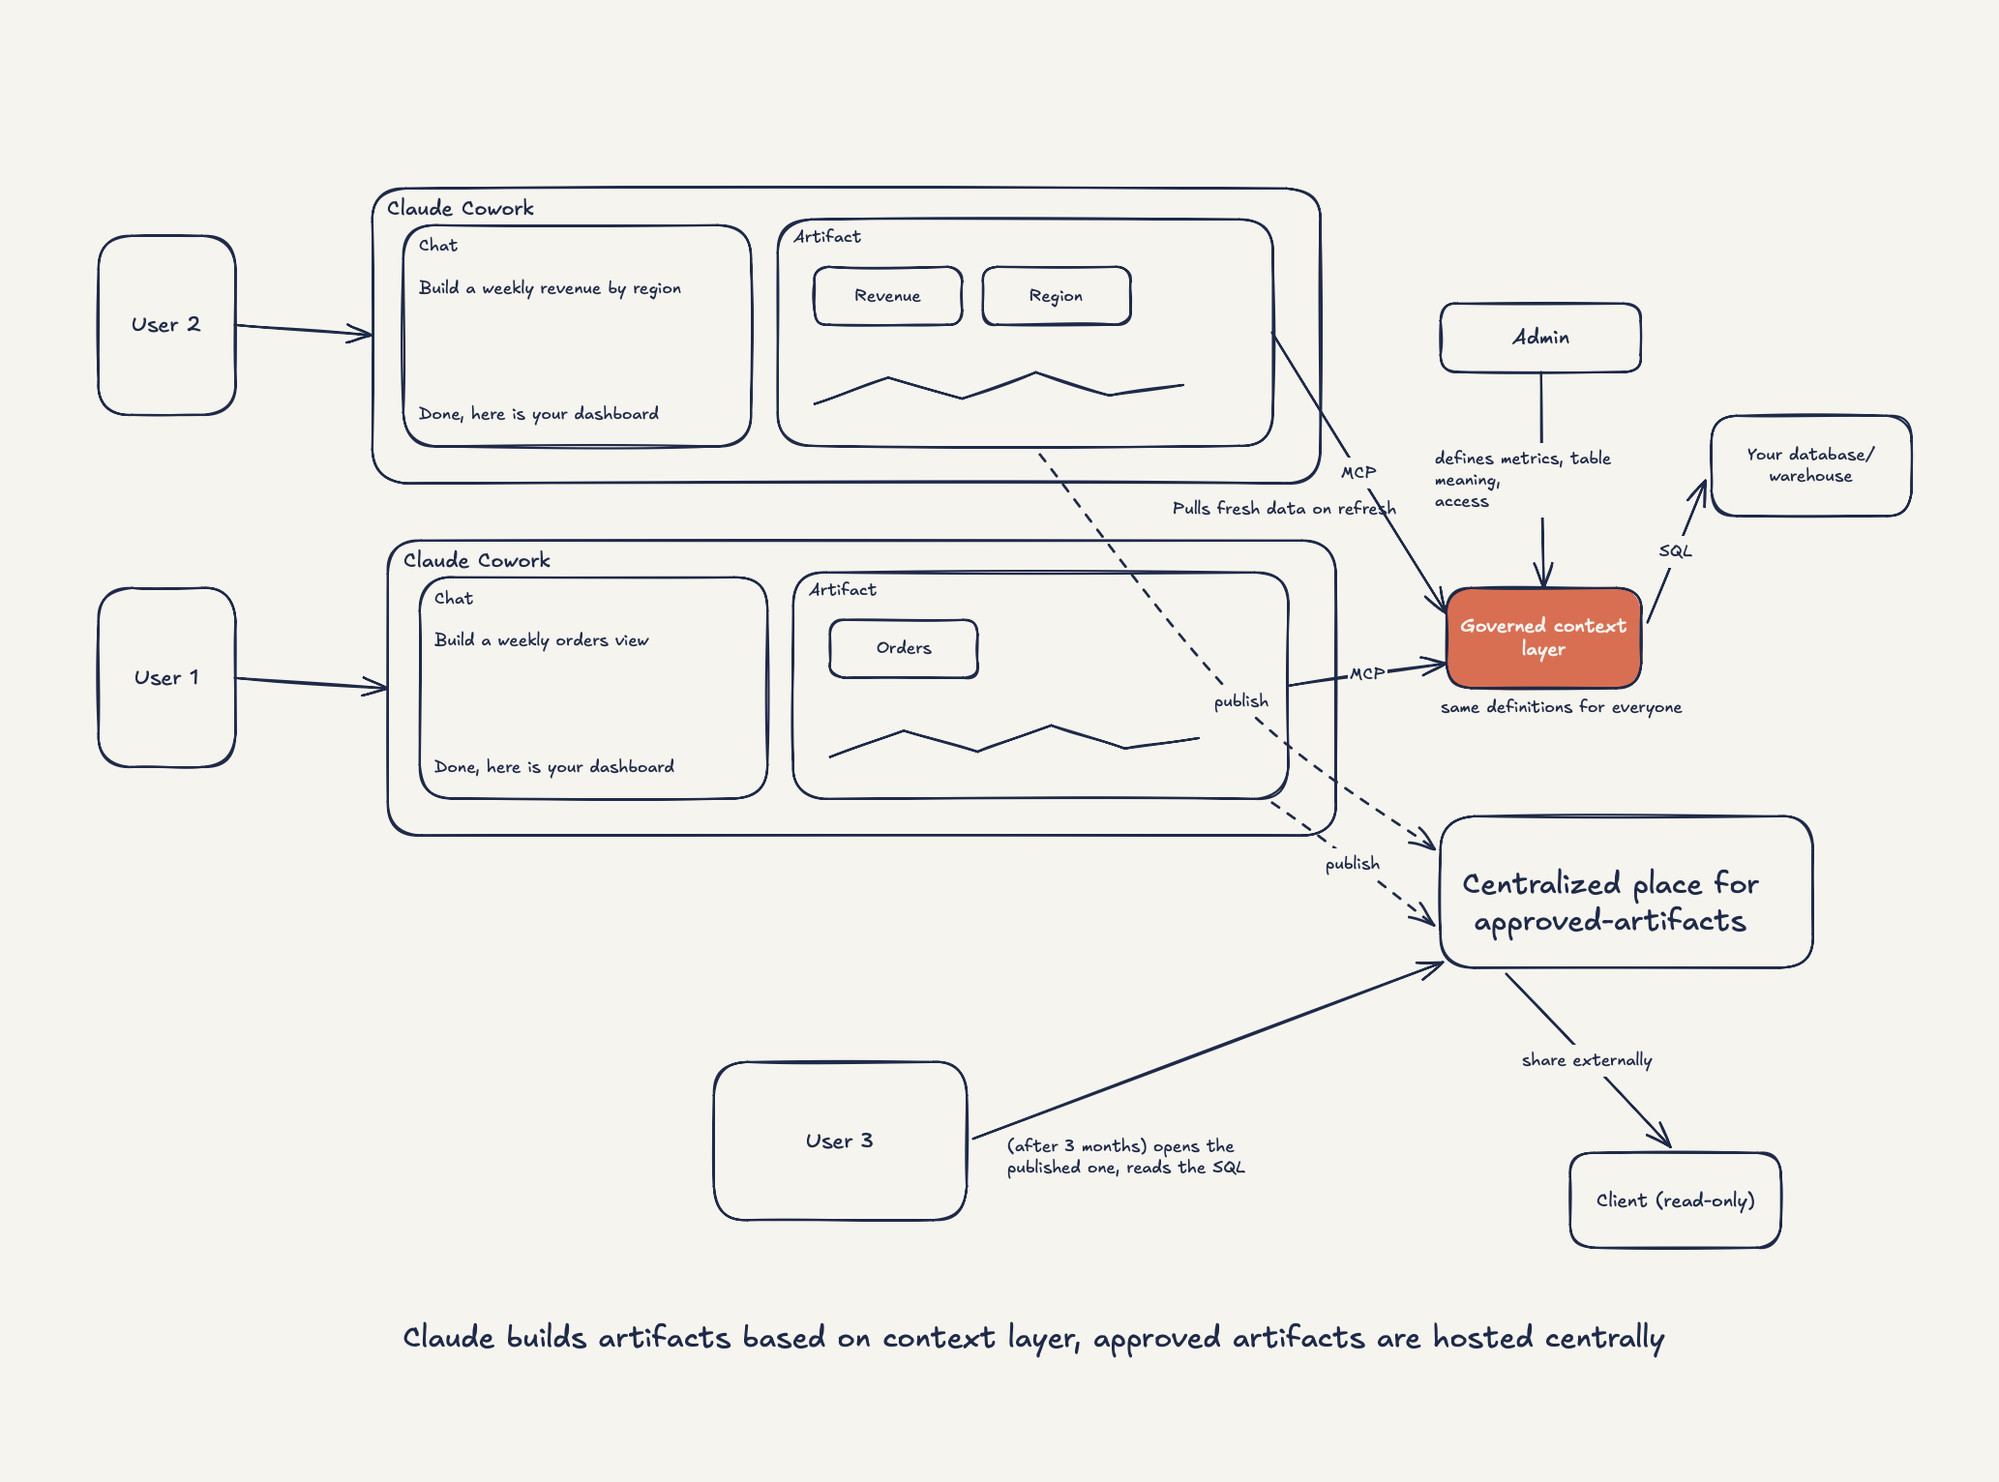
The last step is to take the live artifact out of the chat and put it somewhere it can be audited and shared.
Pros:
- The SQL is on every chart. Anyone can open it and read how the number was produced, today or three months from now.
- One canonical home. Published dashboards live in one place with an owner and a history, instead of scattered across personal sessions.
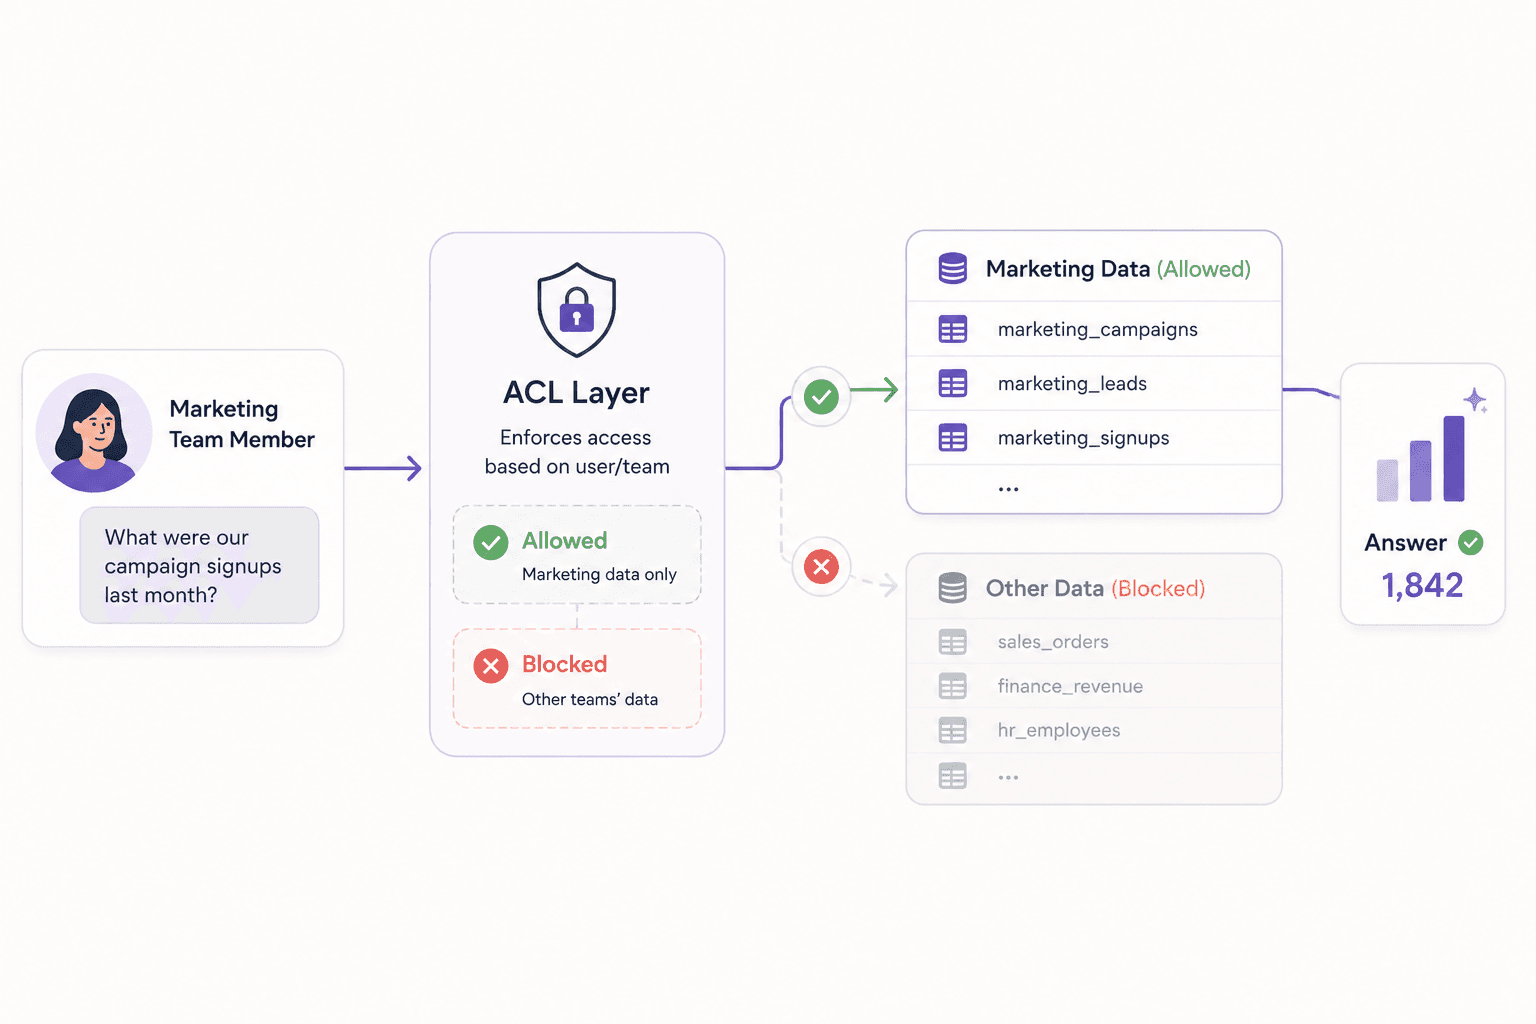
- Sharing is deliberate, and access is enforced at query time. A viewer without access to the payroll tables cannot get payroll numbers out of it, however they ask. An external stakeholder gets a read-only view.
Cons:
- One more step after building. Someone has to publish it, and someone has to own the definitions it depends on.
The order matters a little. Definitions fix correctness. The visible SQL and the boundary make that correctness something other people can verify for themselves.
Which one should your team pick?
- Setup 1 if it is a one-off question and you will not look at it again.
- Setup 2 if you are the only person who will ever open it, and you know the data well enough to catch a wrong number.
- Setup 3 if a team shares dashboards internally, someone is willing to own the definitions, and everyone accepts that the SQL is out of sight.
- Setup 4 the moment anyone other than the builder has to trust a number: a manager, a board, a client. This is the bar a BI tool clears and a raw Claude dashboard does not.
The test for setup 4 is simple. Someone who was not in the conversation that built the dashboard opens it, sees a number, clicks through to the query behind it, and believes it, without pinging the person who made it.
Getting to the governed version directly
You do not have to climb the four setups one at a time. We built Contextflo so a team can start at setup 4.
What is Contextflo?
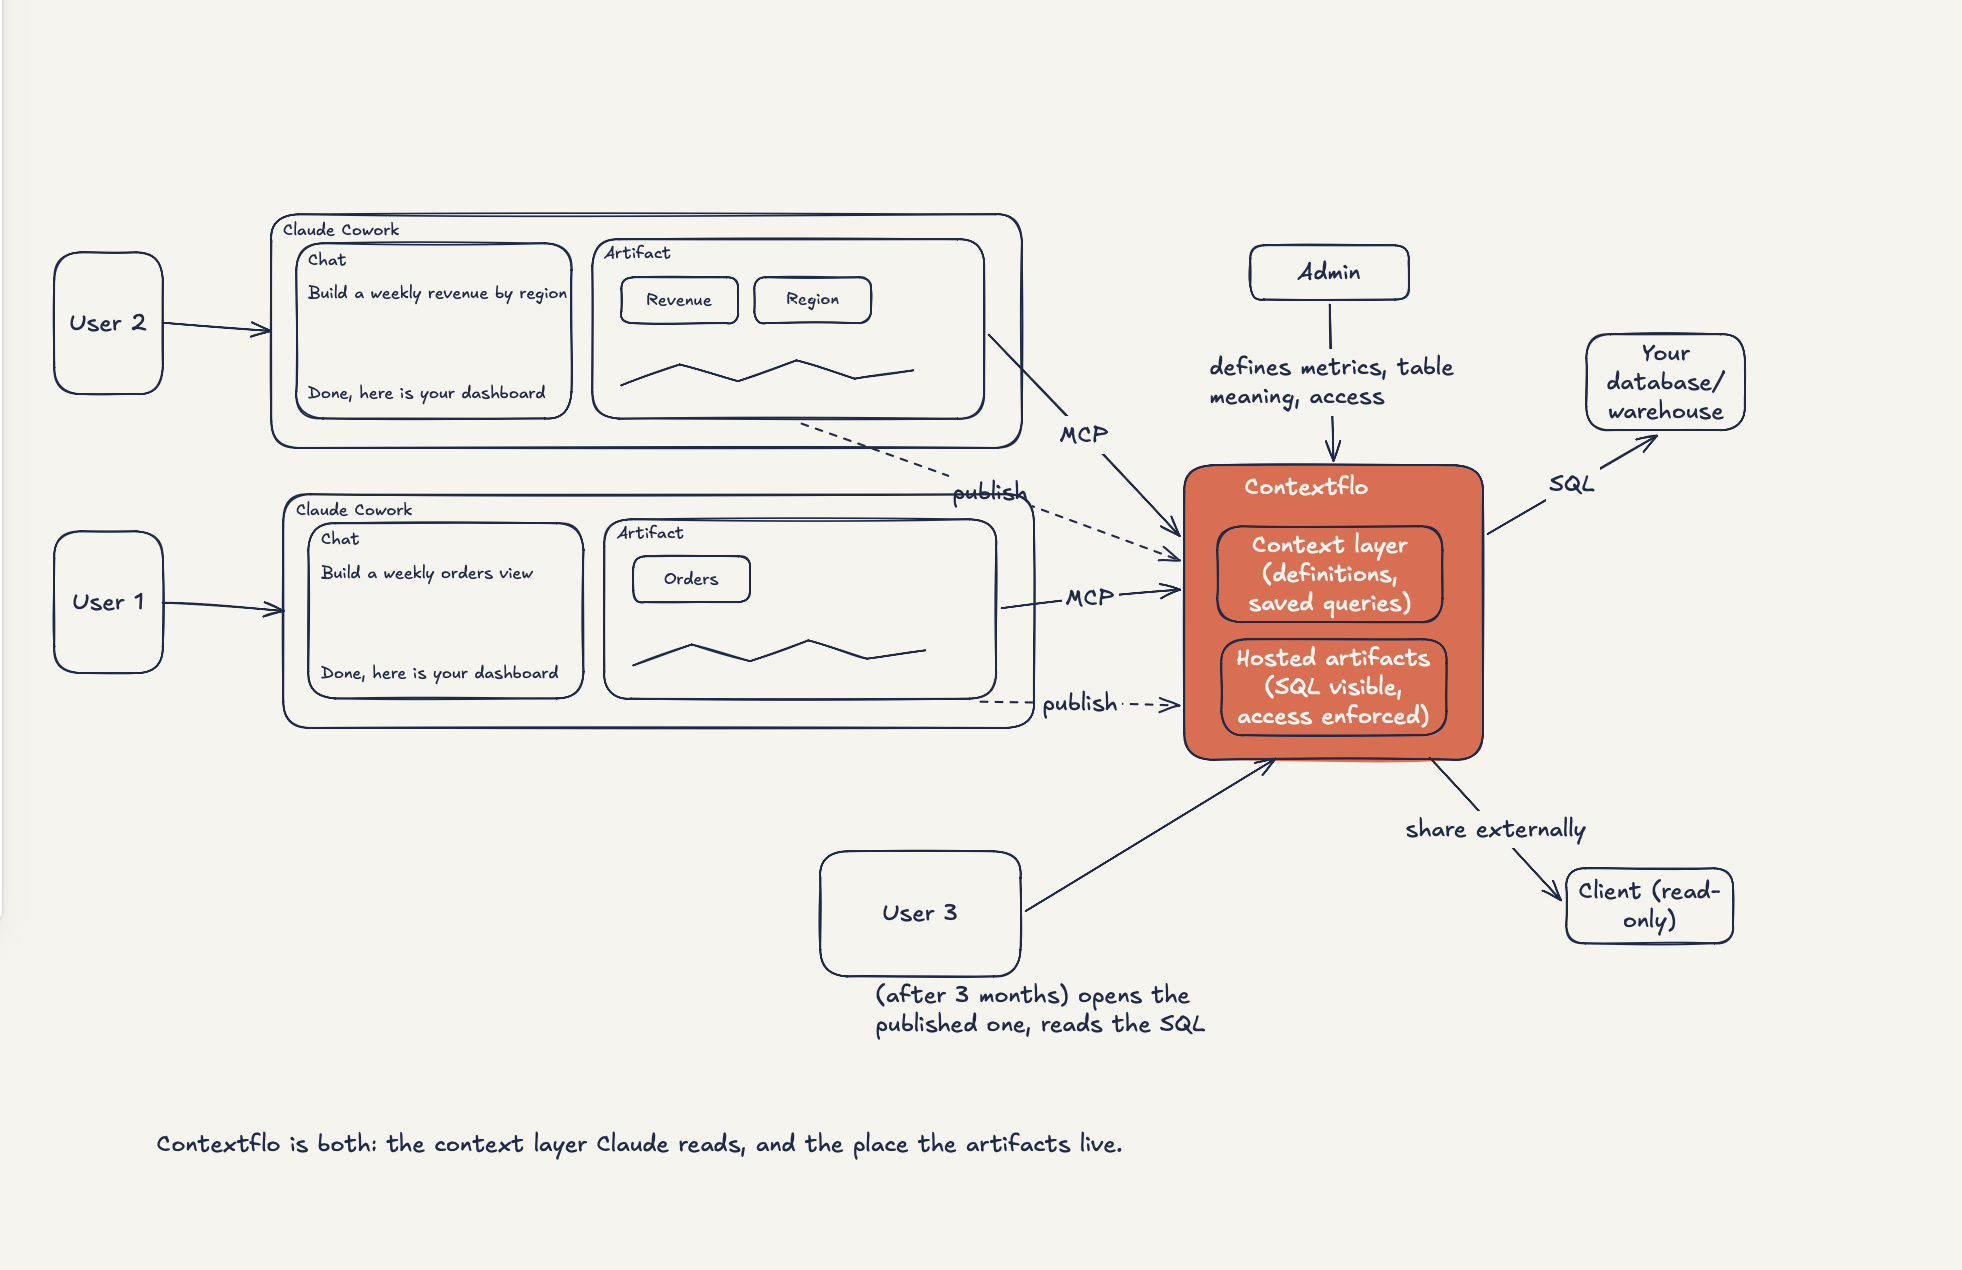
Contextflo sits between Claude and your data. You connect your database or warehouse once, and it becomes the context layer from setup 3: the place where table meanings, metric definitions, and saved queries live, which Claude reads over MCP before it writes any SQL. It is also the central place from setup 4. The artifacts Claude builds get published there, hosted and refreshed on open. The SQL shows on every chart, access is enforced at query time, and you can share by link or give an external viewer a read-only view. You keep using Claude, and Contextflo holds the definitions and shows the SQL behind every number.
Steps to get governed and auditable dashboards using Contextflo and Claude
Step 0, once: connect your data. Point Contextflo at your database or warehouse and let it generate the first draft of context. The full walkthrough is in Getting started with Contextflo, so it is not repeated here. Review the generated metric definitions, fix the ones that matter, and add Contextflo as a connector in Claude.
Step 1: switch to Cowork and ask. Ask for the dashboard the way you would ask a colleague. Claude checks the context first, finds any saved query that already answers part of it, and builds.
Gotcha: live artifacts that pull from your MCP connectors have to be created in Cowork running locally on your machine. If Claude answers with a static chart or says it cannot make one, check that it has access to the mcp__cowork__create_artifact tool in that session.
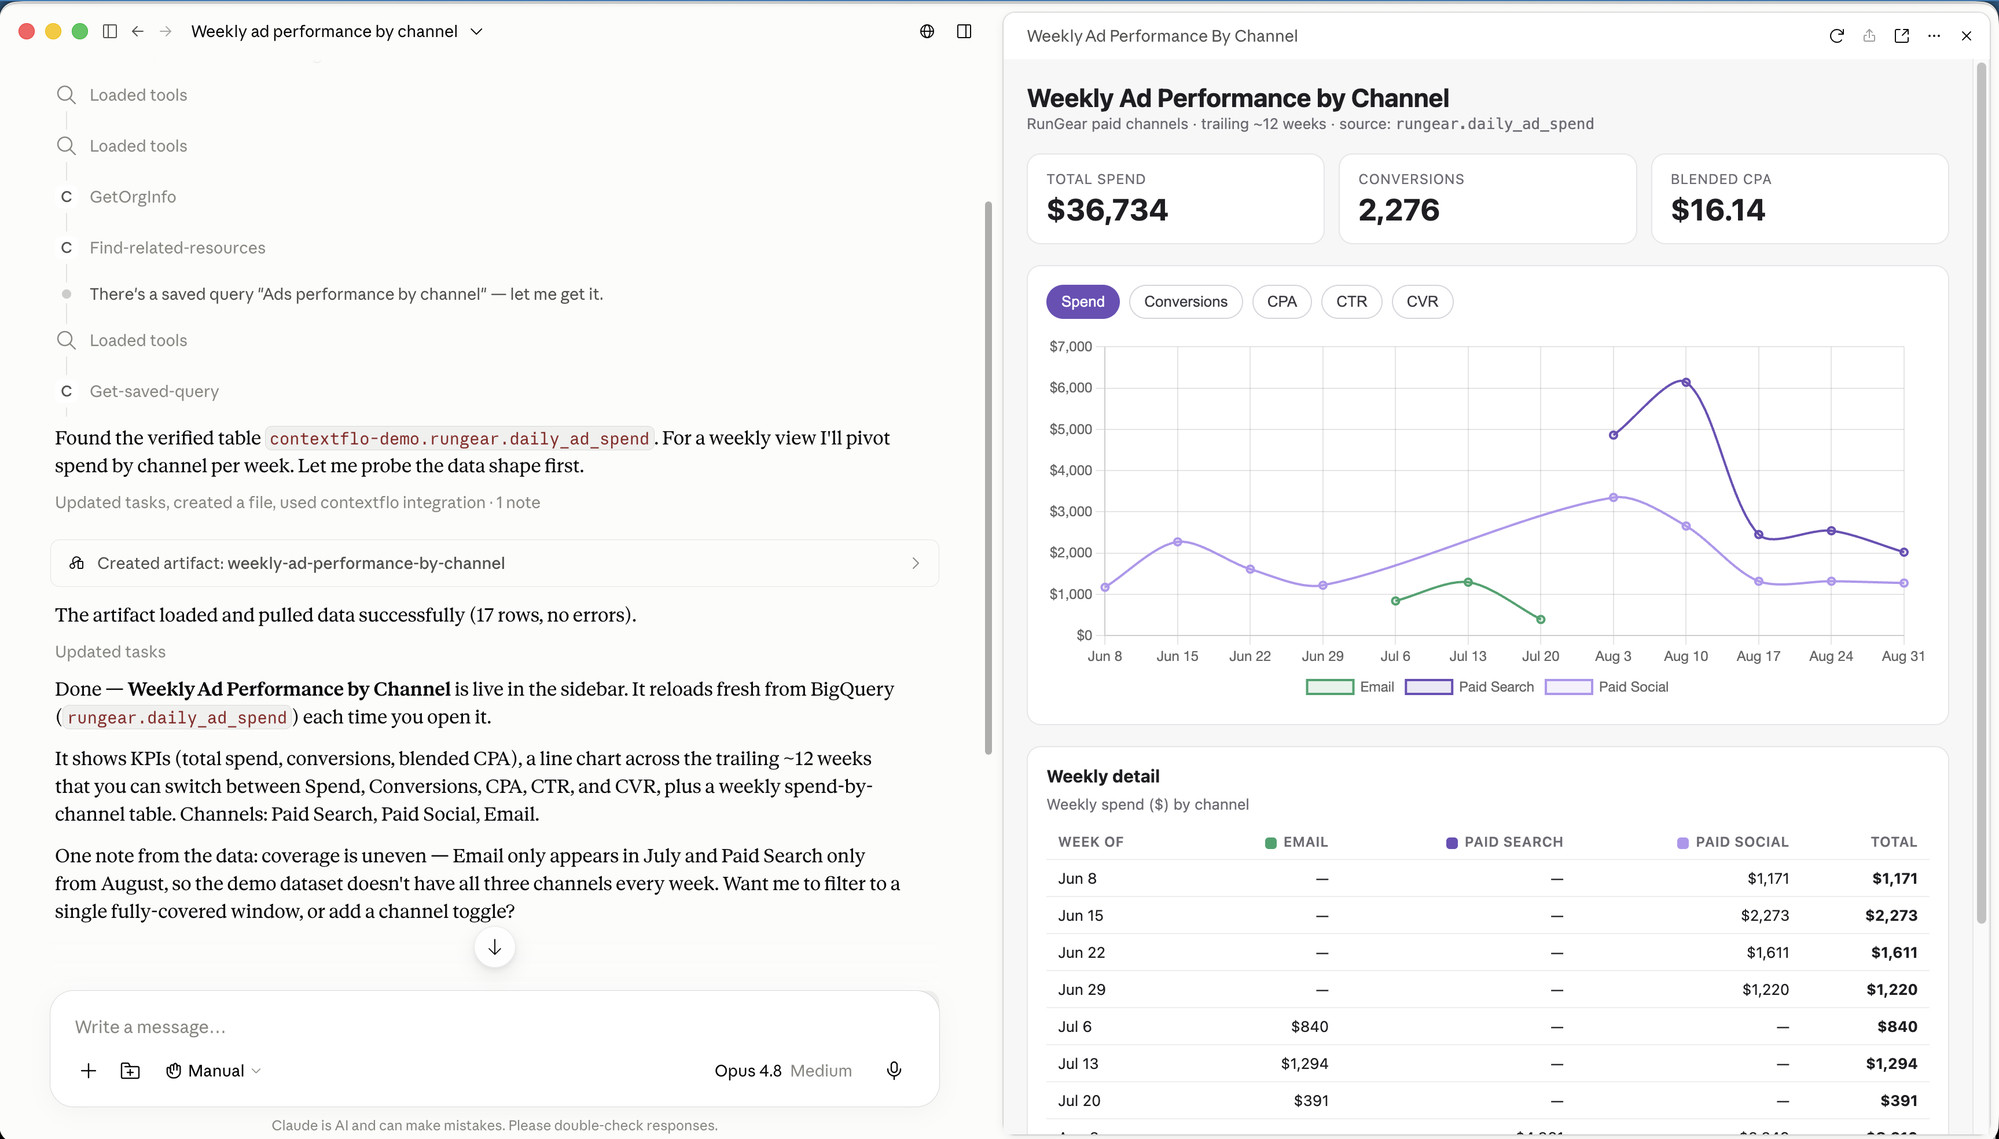
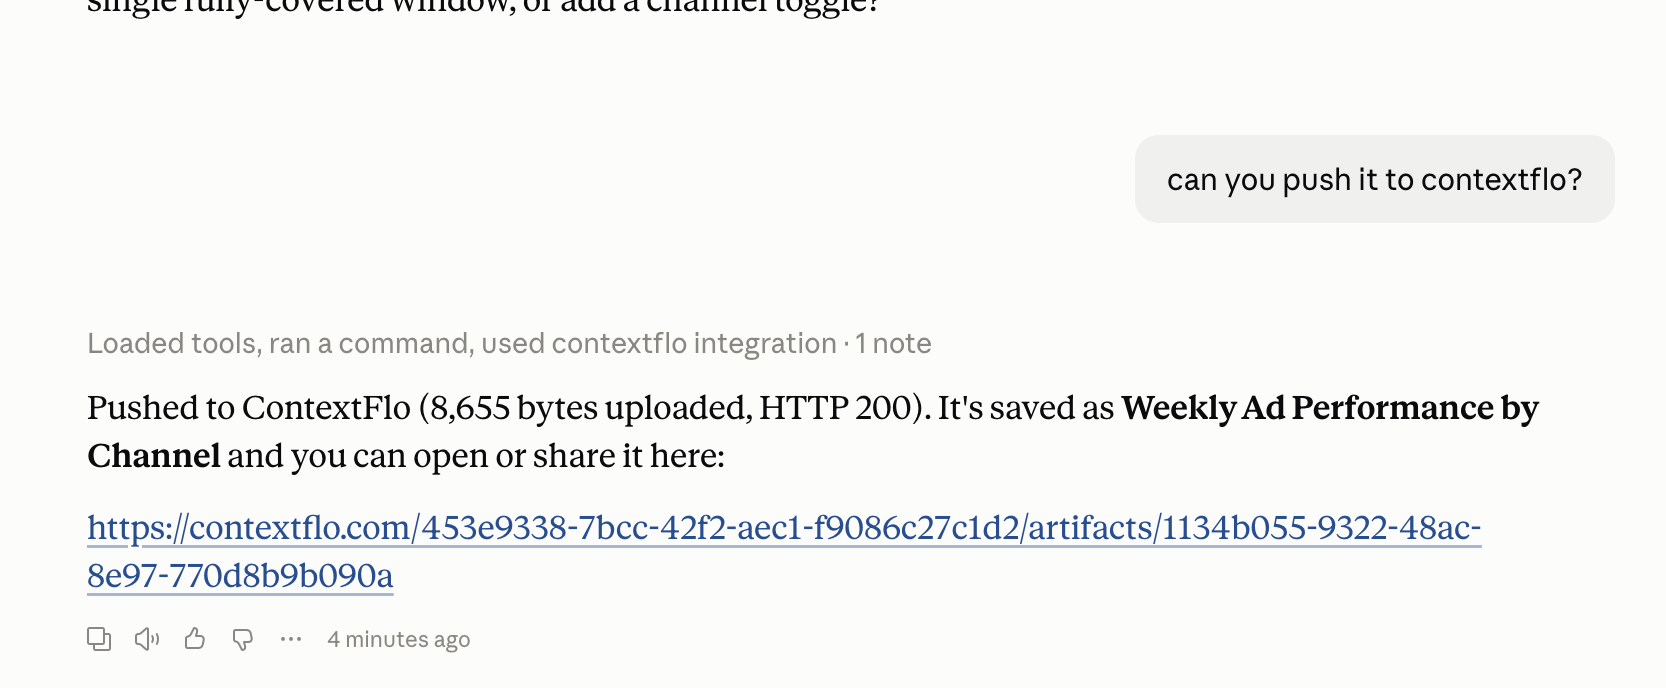
Step 2: ask it to publish. One sentence: "push it to Contextflo." The artifact is exported as is and gets its own URL.
Open it in Contextflo and the SQL panel sits next to the charts. Anyone with access can read exactly how each number was produced.
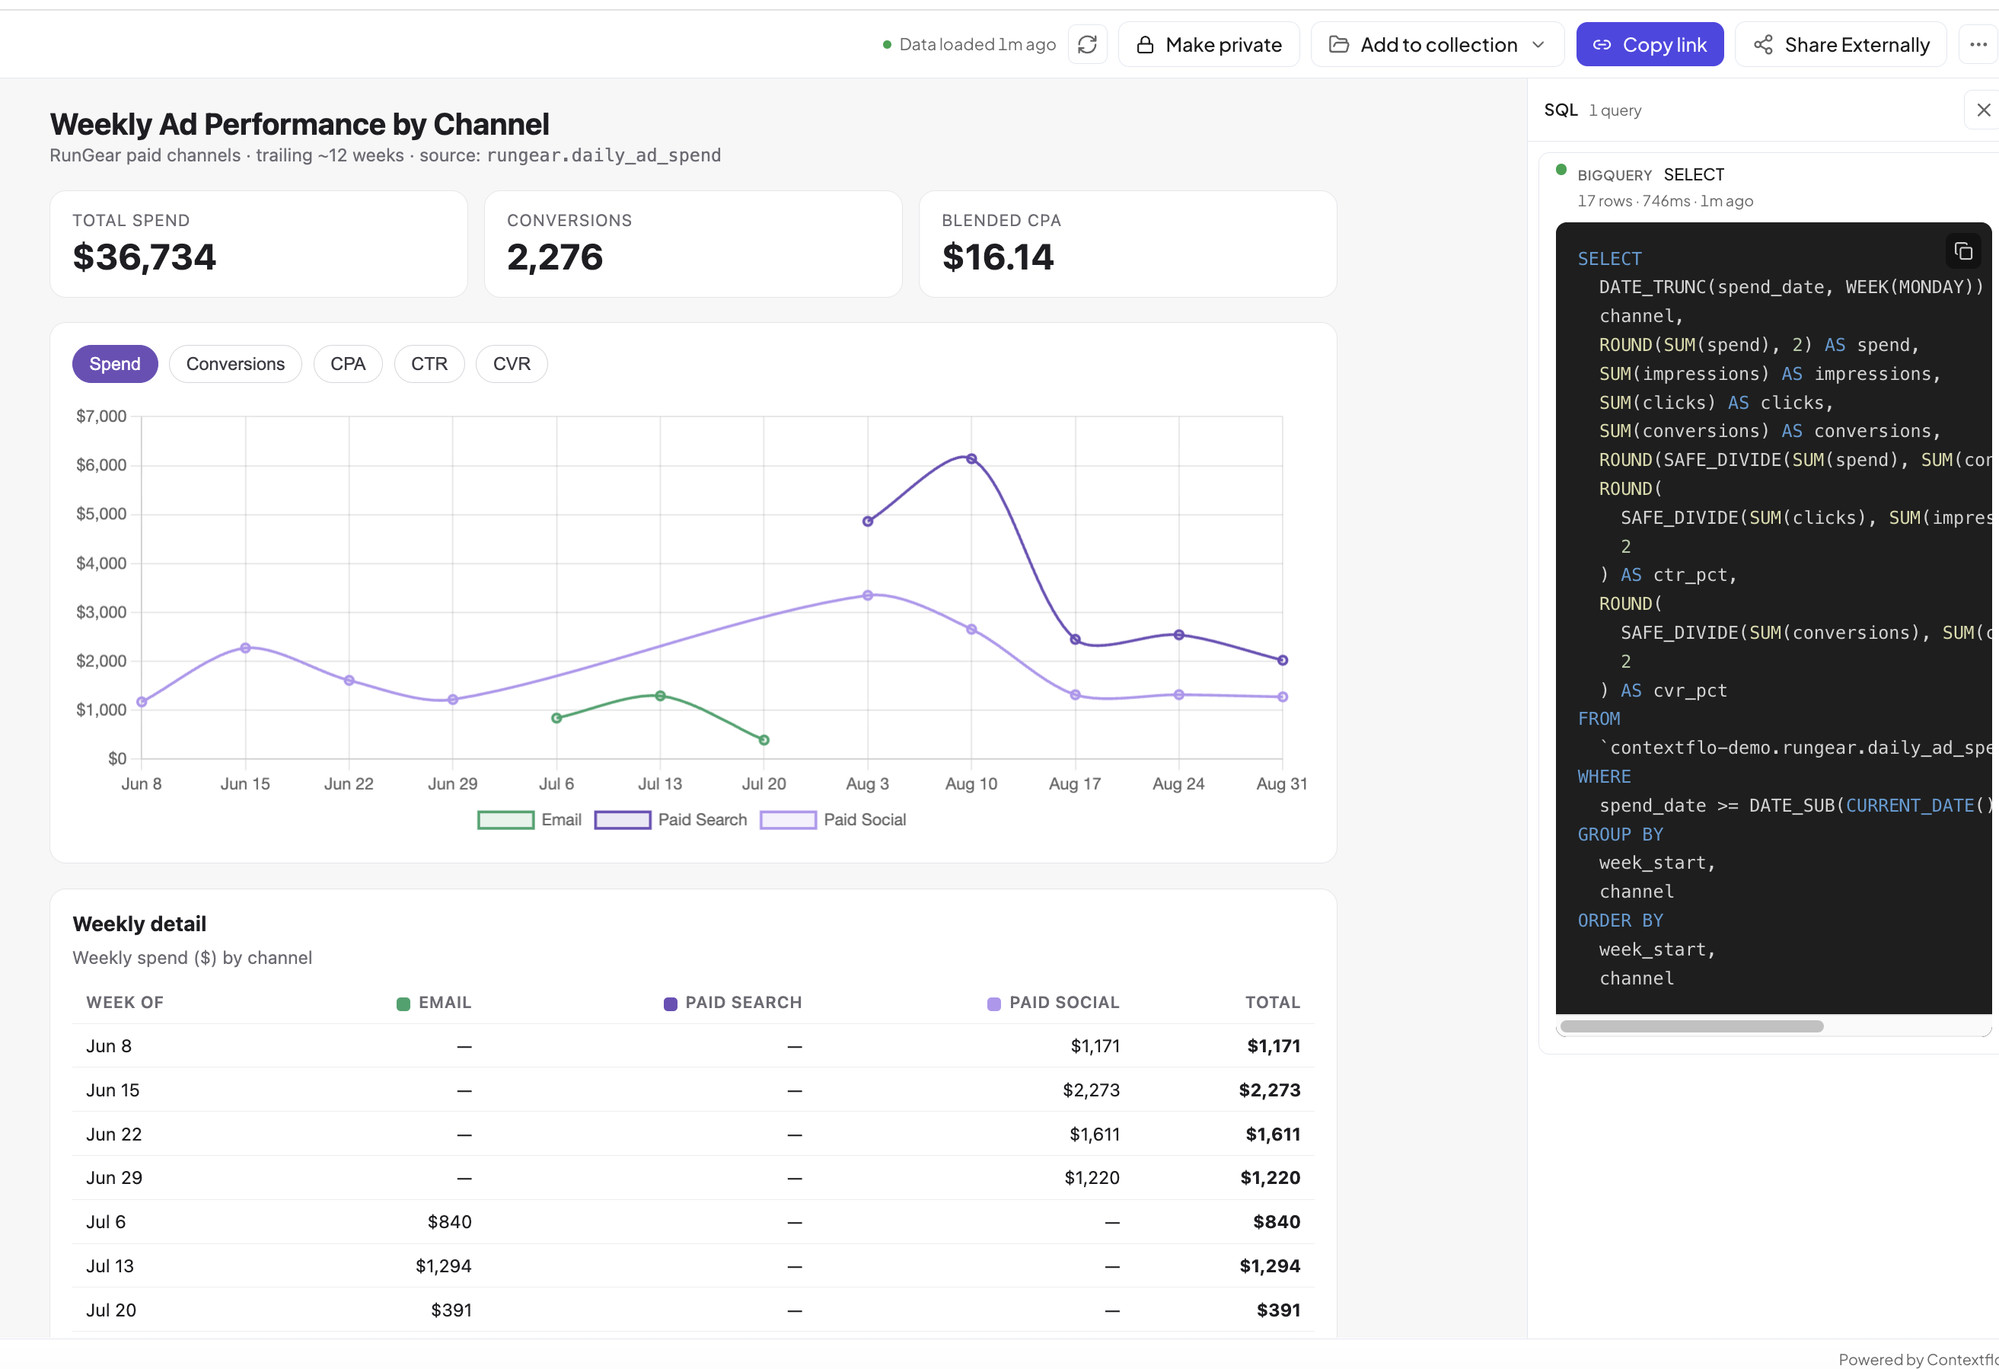
Step 3: share it on purpose. Copy a link for the team, or share externally with a client who is not in your workspace and gets a read-only view. Make it private if it is not ready.
Screenshot needed: the sharing dialog after "Share Externally" (link, read-only, revoke). Caption: "External shares are read-only and can be revoked."
Here is the whole loop in under a minute:
Case study: How a Contextflo customer moved off Power BI to Claude artifacts
One of our customers ran its daily trading numbers out of Power BI. A small revenue-management team maintained the dashboards, and the commercial team waited on them for every cut that was not already built. A question asked in the morning came back the next day.
What changed, in the order the four setups above describe:
- They connected BigQuery and wrote the definitions down. This year versus last year, the fiscal calendar, what counts as a sale. Getting those to match the Power BI numbers was the real work, and it was done once.
- The analysts moved from building in Power BI to asking in Cowork. The daily trading dashboard, pacing against forecast, the automated daily sales report. Plain language on top of the shared definitions.
- They published the artifacts to Contextflo. The commercial team opens the same dashboards, refreshed on open, with the SQL beside each chart. A question about a number is answered by reading the query, not by pinging the analyst.
Today about thirty people across revenue management, marketing, and commercial use it, and the daily trading dashboard has been run well over a thousand times. The analysts still build the dashboards. They just stopped being the only people who could read them.
The building takes minutes. The real work of a trustworthy dashboard is the setup underneath that pins what your numbers mean and shows the query behind them, so people who were not in the room can believe the figure.
FAQ
Can Claude build a BI dashboard from my database? Yes. Connect Claude to your database over MCP and ask for the view you want in plain language. Claude writes the SQL, runs it, and renders the charts. Whether the result is a one-off screenshot or a live dashboard your team can rely on depends on the setup underneath it, which is what this post walks through.
Why do AI-built dashboards show wrong numbers? Usually because the model guessed what a column or metric meant. A wrong guess that lands on a real column returns a plausible number instead of an error, so nobody notices until the figure is challenged. The fix is defining the metric once, pinning the verified query, and showing the SQL behind every answer.
Can a Claude dashboard be trusted for reporting to stakeholders? Only if the answer is reproducible and inspectable. That means a saved metric definition, a fixed query the dashboard re-runs, the SQL visible on each chart, and a query-time access boundary so people only see what they are allowed to. Without those, a good-looking dashboard is still a guess.
See it on your own data.
Connect your warehouse and your team can ask Claude about it the same day, without waiting on a data team. Want a walkthrough first? Grab 20 minutes.
Book a 20-minute callSee how teams use Contextflo

Related posts
Keep reading
Conversational analytics: 5 ways to set it up, compared
7 min read
How to connect Claude to BigQuery? What works and what doesn't in 2026
8 min read
How to connect Claude to Postgres without giving it write access
9 min read
How to give Claude read-only access to your database (it isn't always the default)
7 min read

You connected your warehouse to Claude, now what?
5 min read
ClickHouse MCP: how to connect ClickHouse to Claude, Cursor or Codex
6 min read
Query BigQuery from the Codex CLI with MCP
5 min read
Run ClickHouse queries from Codex with MCP
6 min read
Databricks in Codex: Genie One MCP or Contextflo
5 min read