
"Semantic layer" sounds like a data-team project. The smallest useful version is not. In the next 20 minutes you can build one and watch it change an answer, using a spreadsheet, a few plain-English definitions, and Claude. No modeling tools and no engineer.
You do not have to write code to follow along. The point is to see the one job a semantic layer does: make the answer use your definition of a number, instead of one the software guessed from the column names.
We will ask "What was revenue?", watch Claude get it wrong, then make it right. The tools that data teams use for this at scale (Looker, dbt, Cube) become relevant later, once the definitions have to work across a whole team and live data.
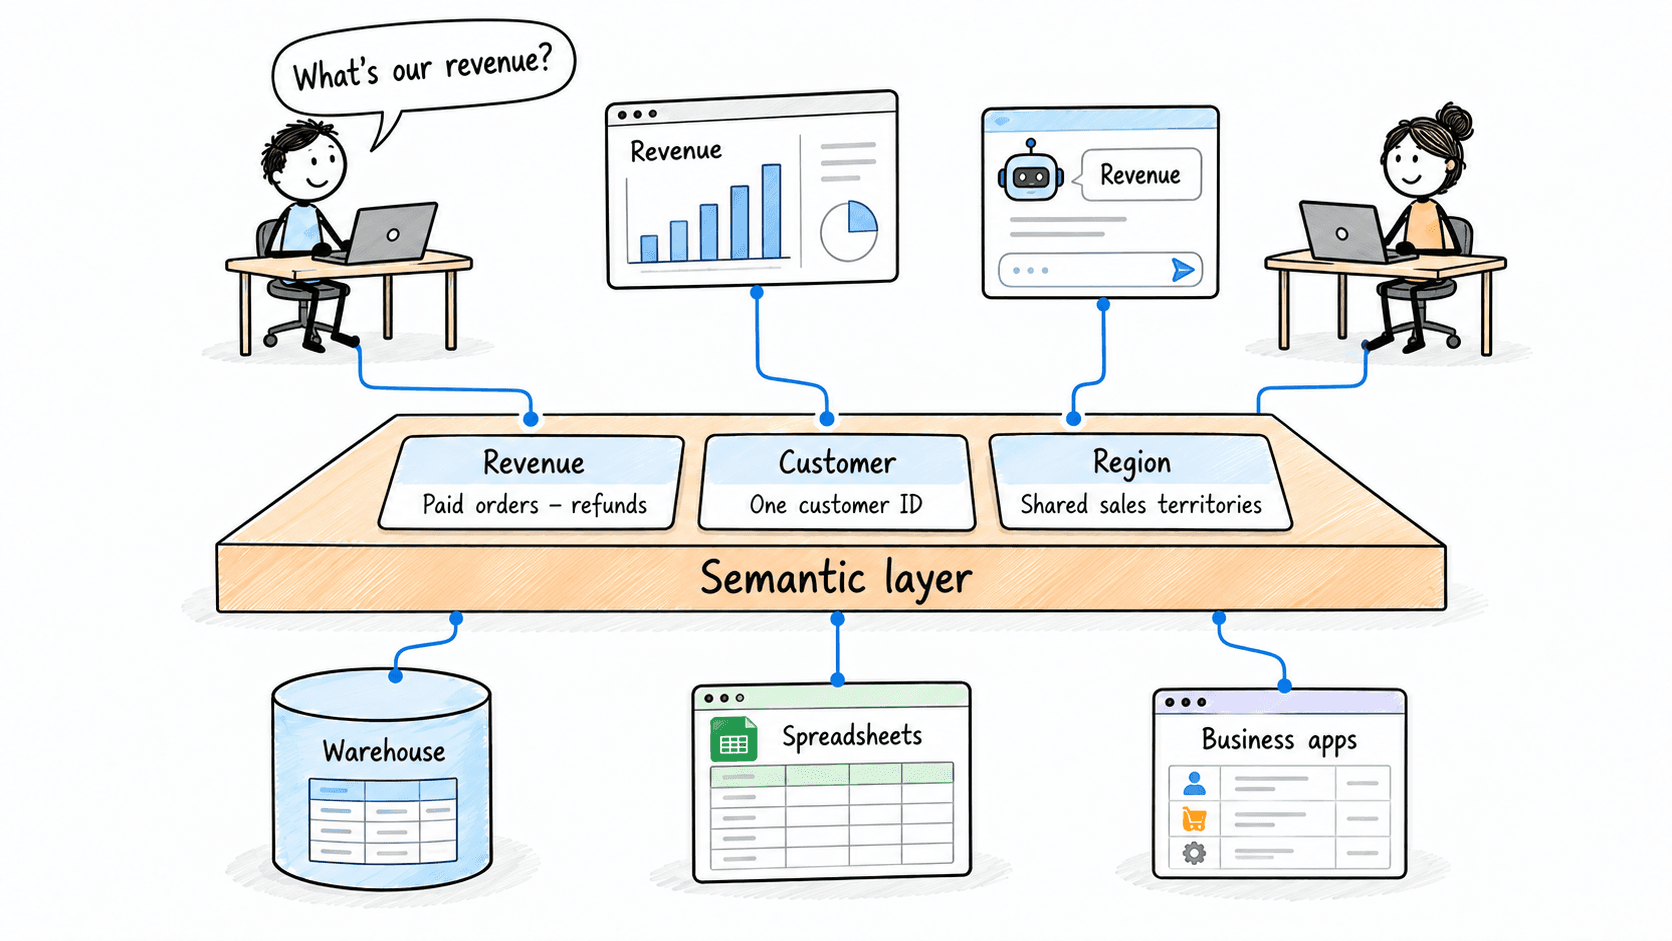
First, what is a semantic layer?
A database stores data. It does not store the decisions people make when they interpret that data.
An orders table might have amount, status, and created_at. It does not tell you whether revenue includes refunds, whether test orders count, or which timezone defines the end of the month.
A semantic layer writes those decisions down and makes them available whenever someone queries the data.
Data: order 1002 has an amount of $85 and a status of refunded.
Semantics: refunded orders do not count toward revenue.
That second line is the layer.
The data
Picture four orders from last month, the kind of thing you already have sitting in a spreadsheet.
| Order | Customer | Amount | Status | Date |
|---|---|---|---|---|
| 1001 | C-14 | $120.00 | completed | Aug 2 |
| 1002 | C-21 | $85.00 | refunded | Aug 3 |
| 1003 | C-14 | $70.00 | completed | Aug 4 |
| 1004 | C-38 | $40.00 | test | Aug 5 |
Add up the Amount column and you get $315. That is the number software hands you when nobody has told it any better. It is also wrong: it counts a refund and a test order as if they were sales.
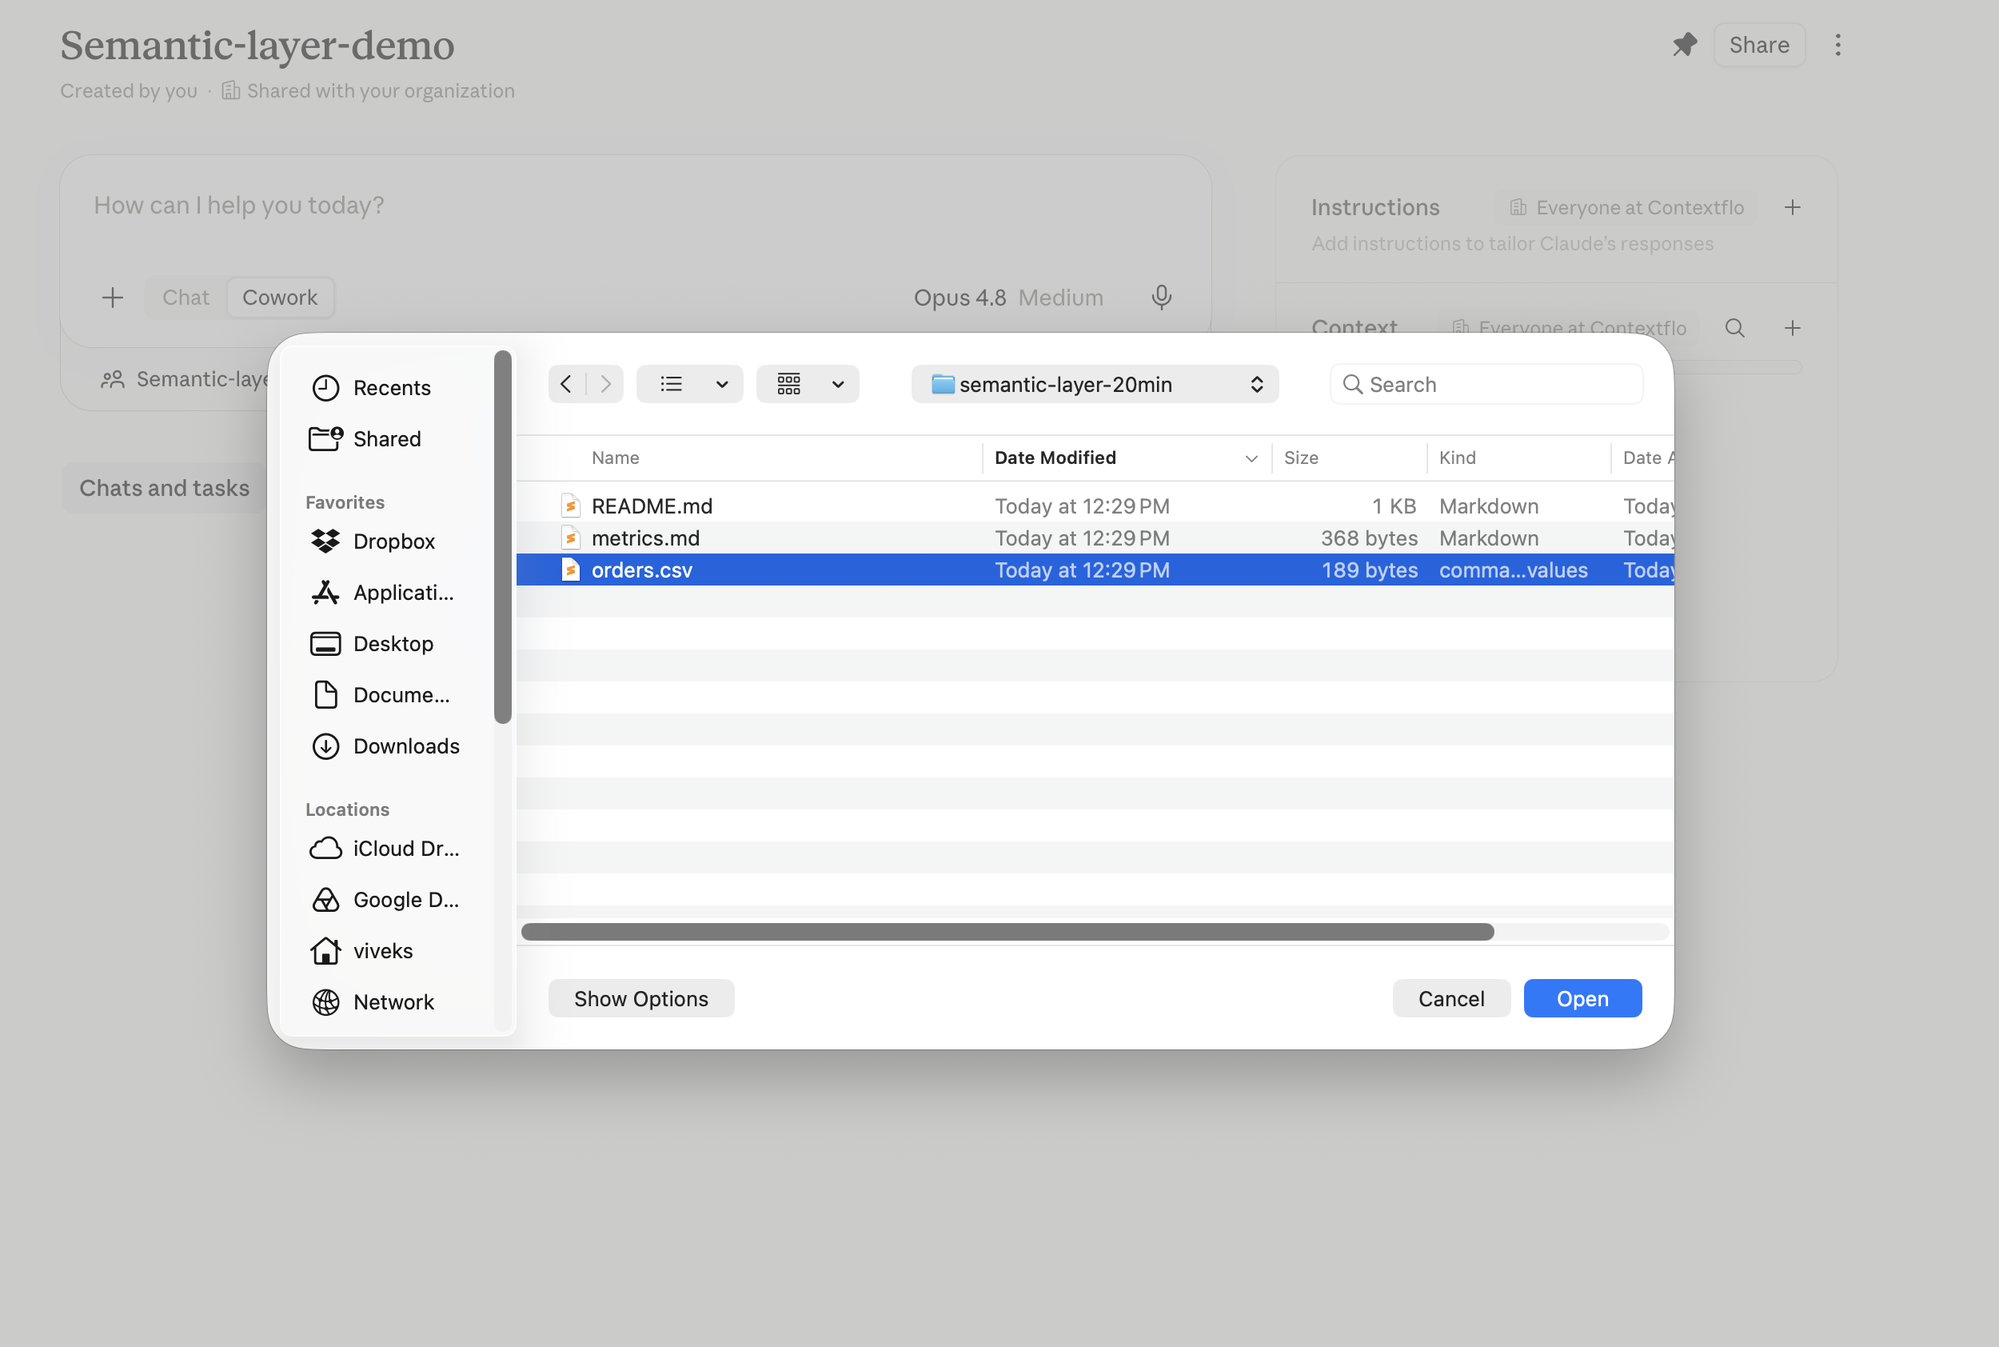
If you want to build along, save those same four rows as a file called orders.csv. If you would rather just read, the table above is all you need to follow the rest.
order_id,customer_id,amount,status,created_at
1001,C-14,120.00,completed,2026-08-02
1002,C-21,85.00,refunded,2026-08-03
1003,C-14,70.00,completed,2026-08-04
1004,C-38,40.00,test,2026-08-05
Write the meaning down
Now write down what the numbers actually mean, in plain sentences, in a second file called metrics.md. This is the whole trick. It is not code, it is the decisions a person makes when they read the table above.
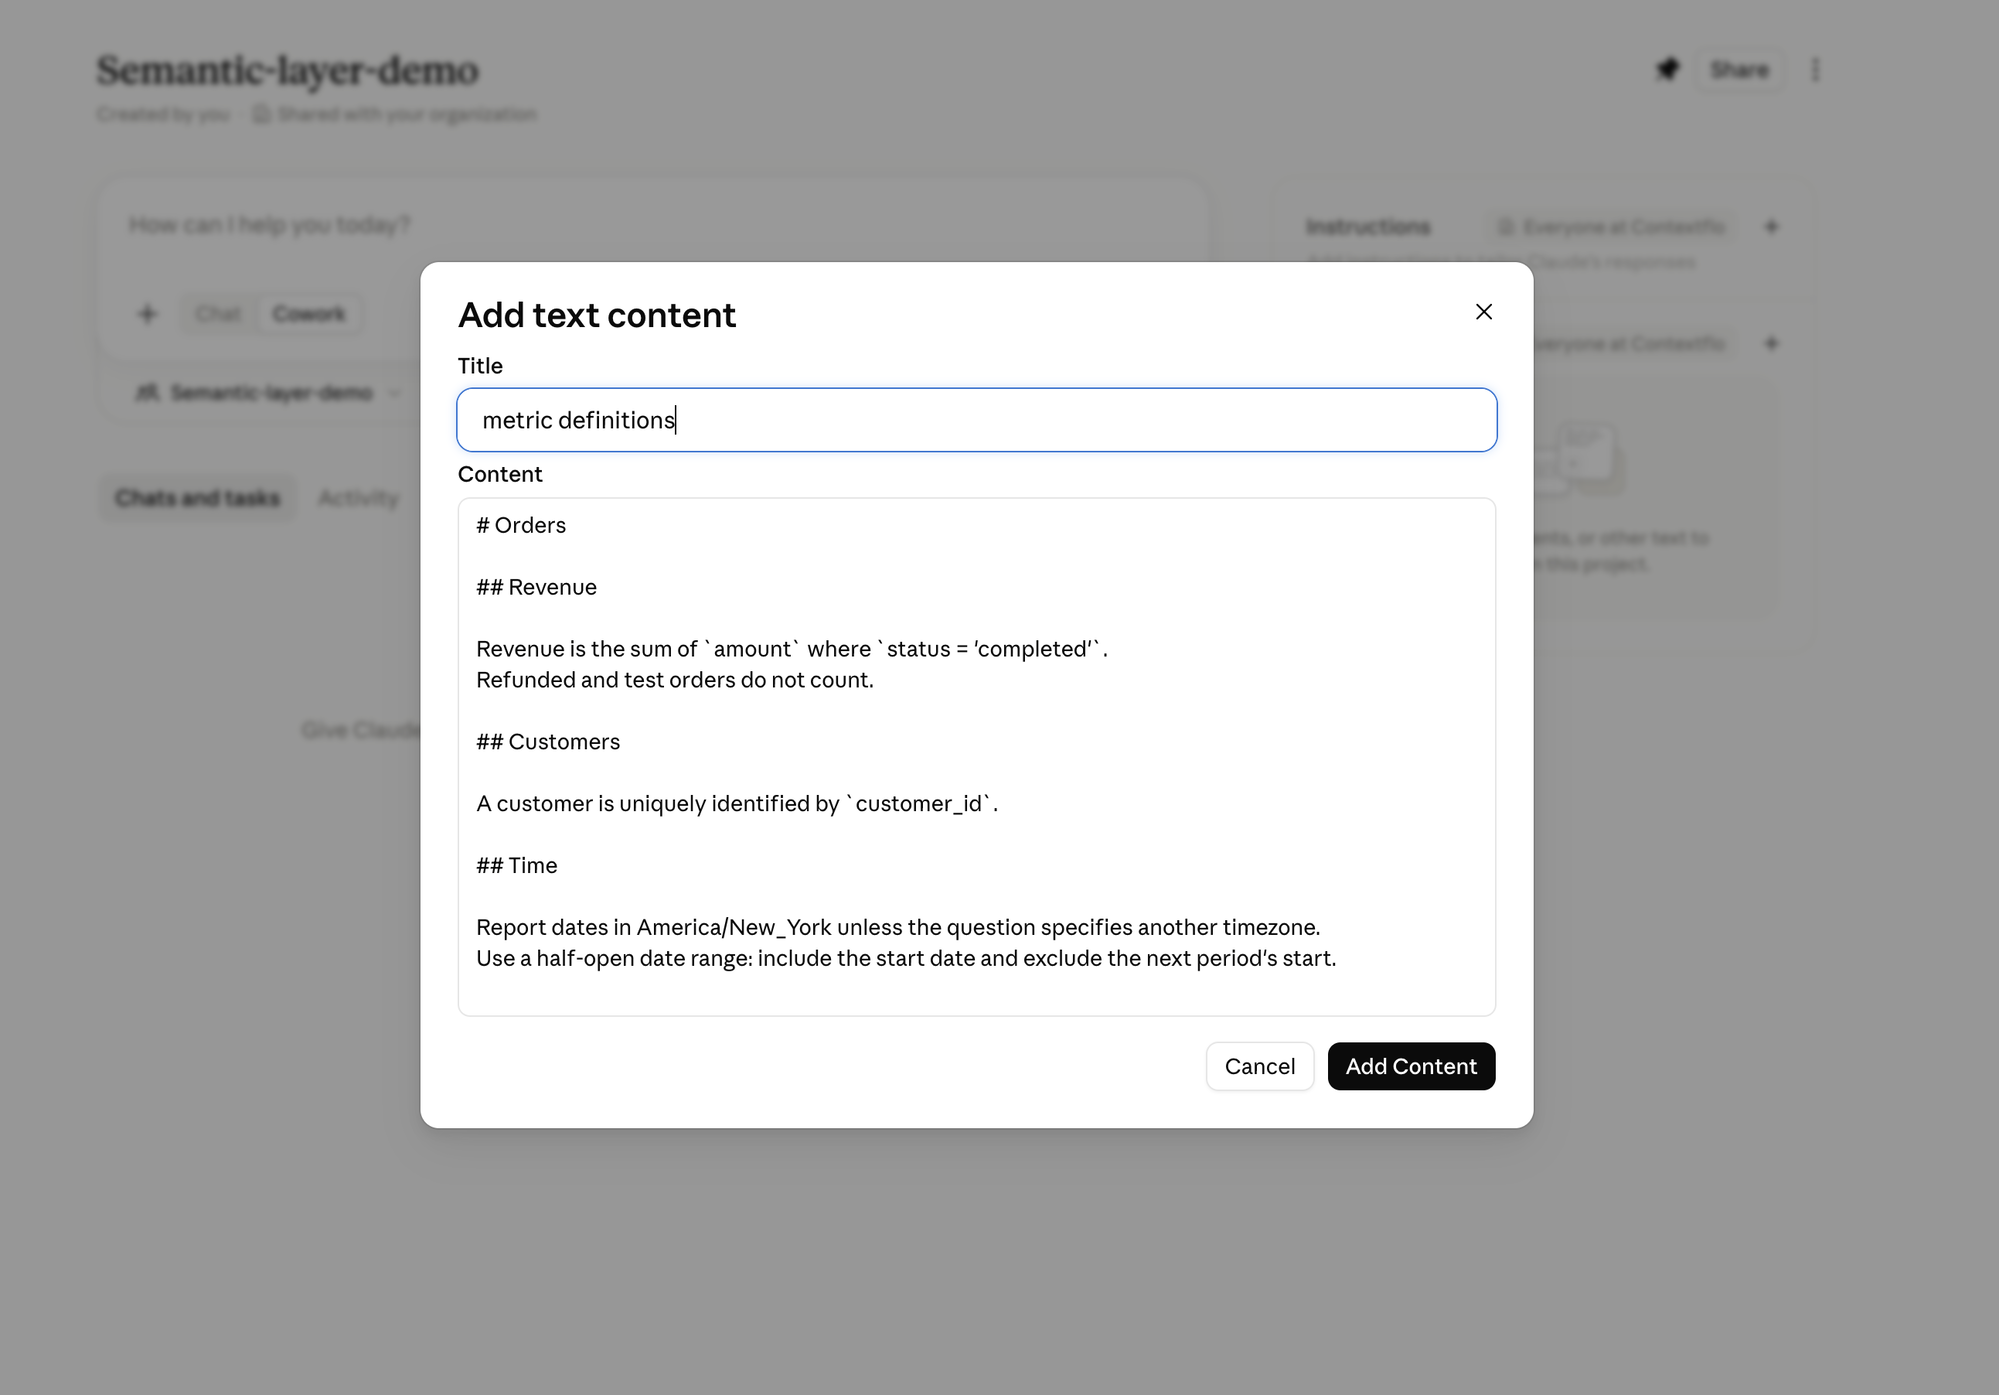
# Orders

## Revenue

Revenue is the sum of `amount` where `status = 'completed'`.
Refunded and test orders do not count.

## Customers

A customer is uniquely identified by `customer_id`.

## Time

Report dates in America/New_York unless the question specifies another timezone.
Use a half-open date range: include the start date and exclude the next period's start.
You have now made four implicit business decisions visible:
- which field contains money;
- which order states count;
- what identifies a customer; and
- how reporting periods are bounded.
The file format is not important yet. The fact that the decisions exist in one place is.
Hand both files to Claude
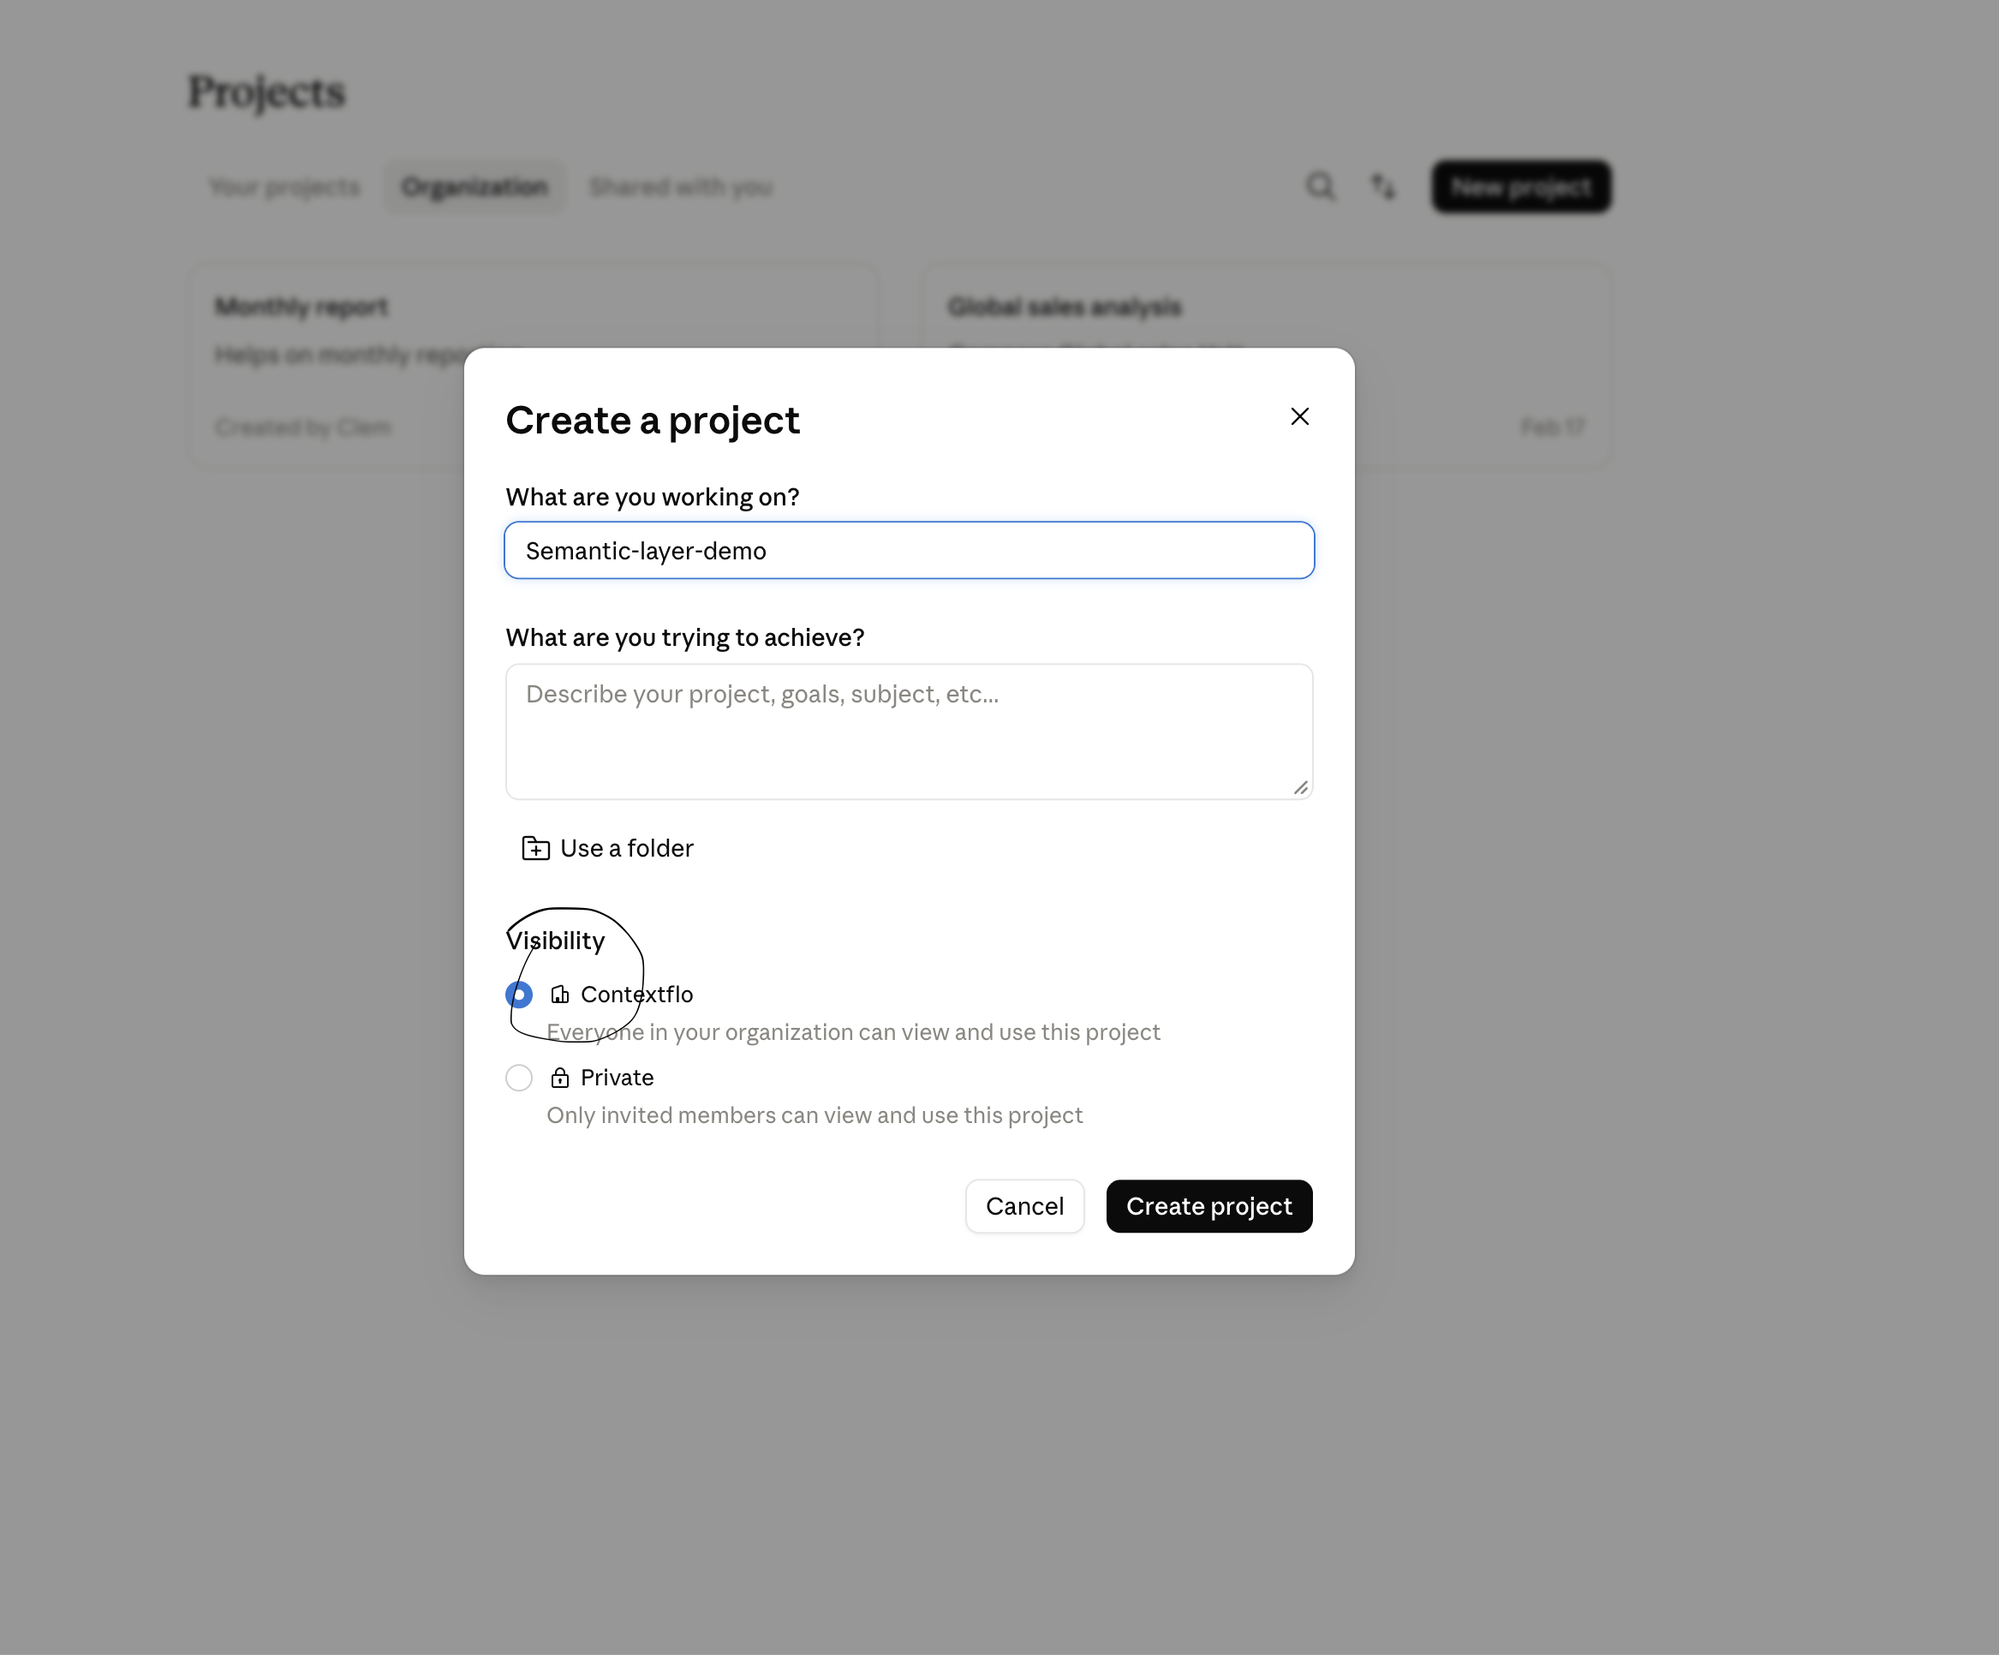
Create a Claude Project. It is the shared space where the data and its definitions live together, so every chat inside it starts from the same context. Claude supports CSV analysis in its built-in computing environment, and project files stay available as context across the project's chats. Anthropic documents both capabilities here.
Put the definitions into the project's knowledge. You can paste metrics.md straight in as text, or upload the file.
Then add the data itself, orders.csv.
Finally, set the project instruction, so Claude reads the definitions before it ever touches the data:
Before analyzing orders.csv, read metrics.md.
Use the definitions in that file as the source of truth.
Show the calculation or query behind every answer.
If a question is not covered by the definitions, say what you had to assume.
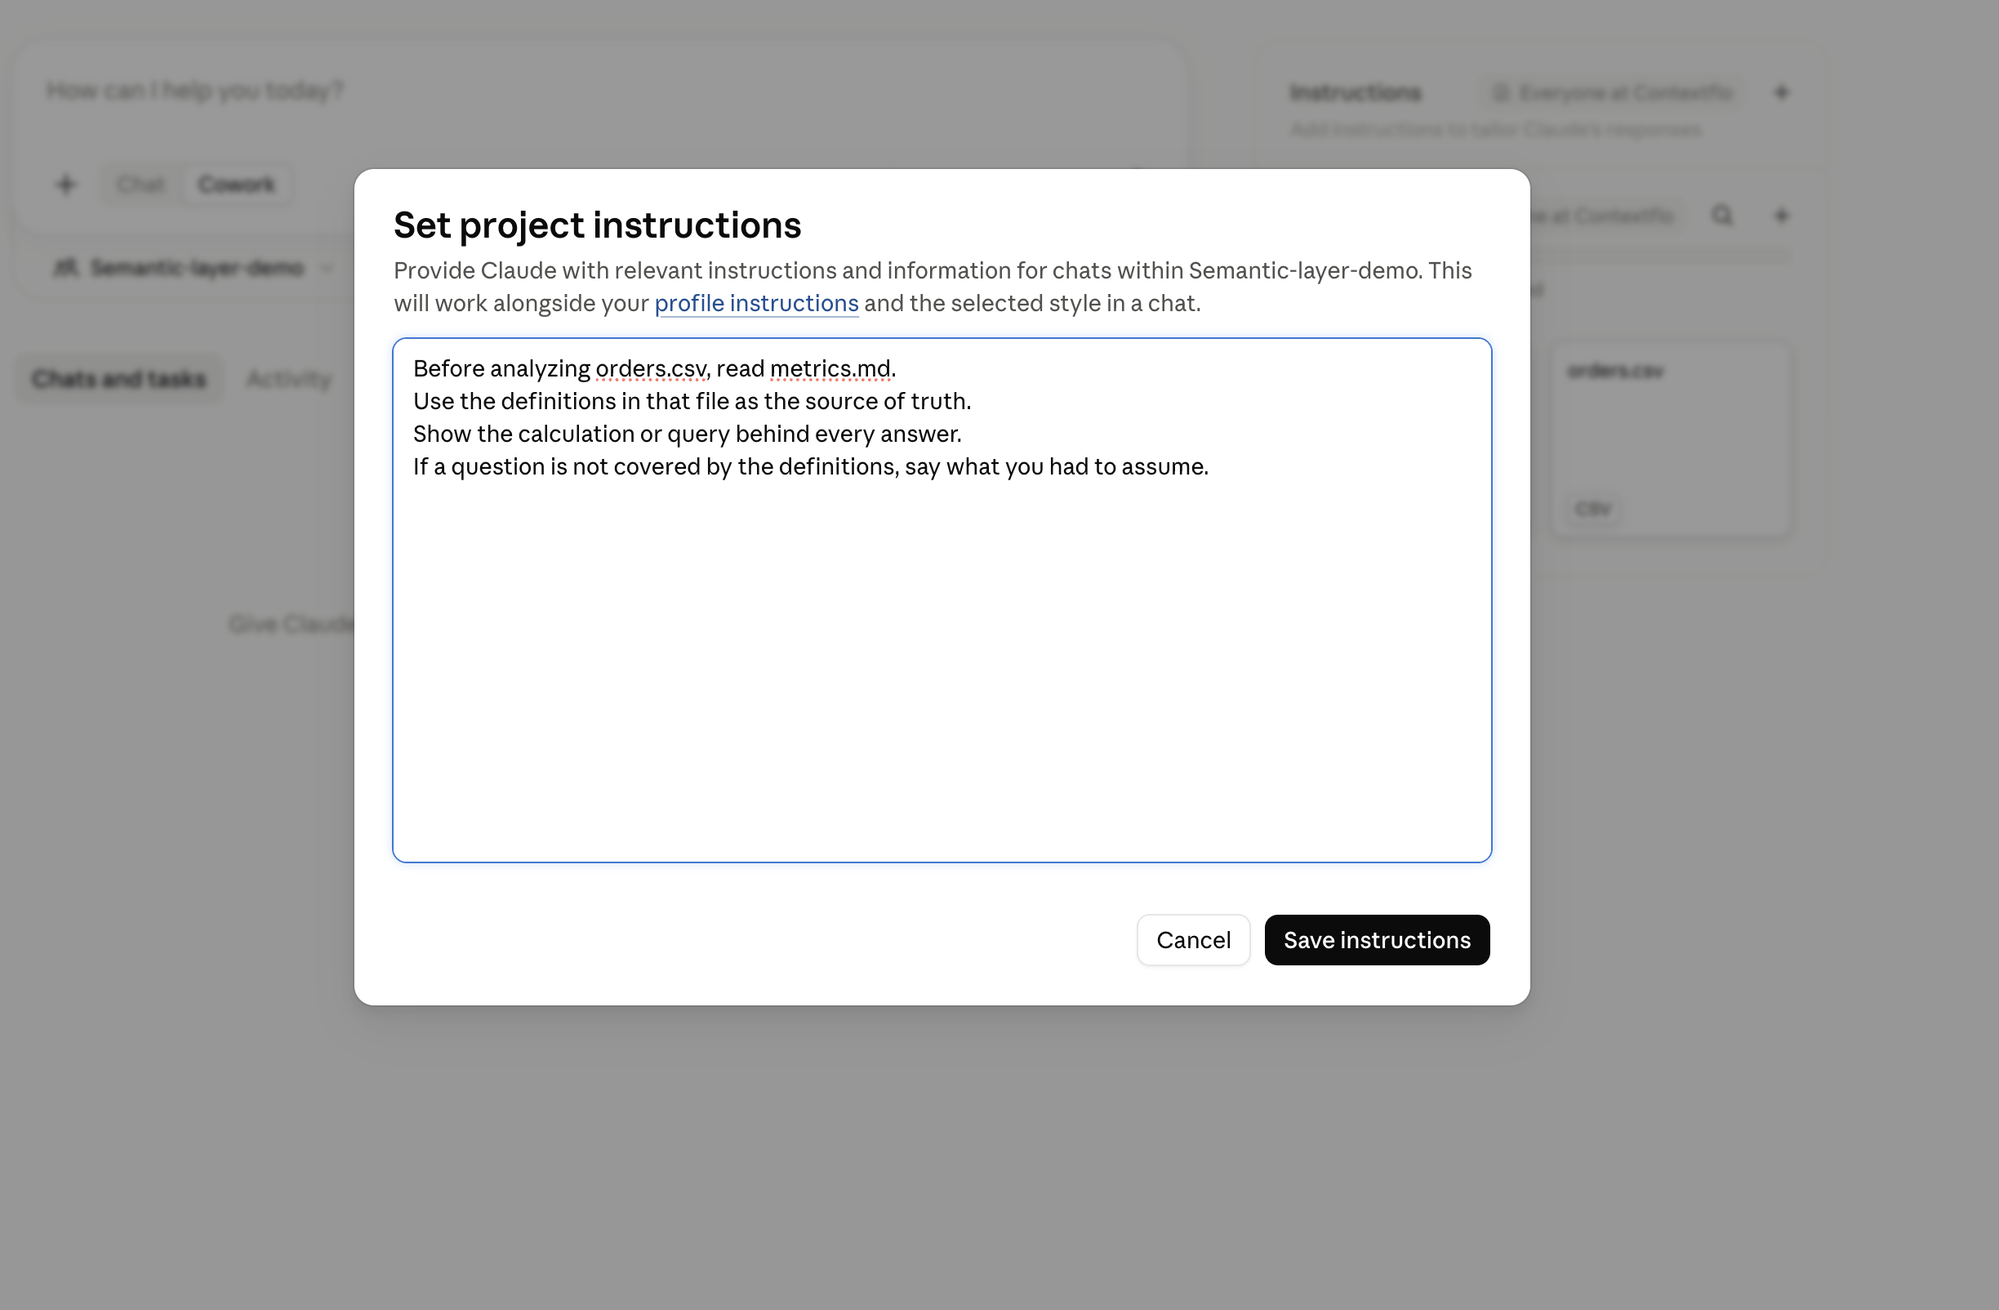
That last line matters. A useful semantic layer does not make uncertainty disappear. It makes uncertainty visible before someone acts on the answer.
Watch it answer
Ask, in plain English:
What was revenue in August 2026? Show me the calculation and which rows you left out.
Claude reads metrics.md first, then answers $190. It shows its work: the two completed orders added together ($120 + $70), with the refund and the test order left out, exactly as your definition says. The naive $315 from a minute ago is gone, and you can see why.
It even caught something you did not ask about. The created_at values are plain dates with no time or timezone, so Claude noted that it had treated each as already being the New York calendar date, and said the assumption did not change the result. That is the instruction's last line doing its job: a small uncertainty surfaced instead of buried.
The same rule written as SQL, for when this graduates from a CSV to a real database, looks like this:
SELECT SUM(amount) AS revenue
FROM orders
WHERE status = 'completed'
  AND created_at >= DATE '2026-08-01'
  AND created_at < DATE '2026-09-01';
The layer earns its keep on the next question. Ask something you never defined:
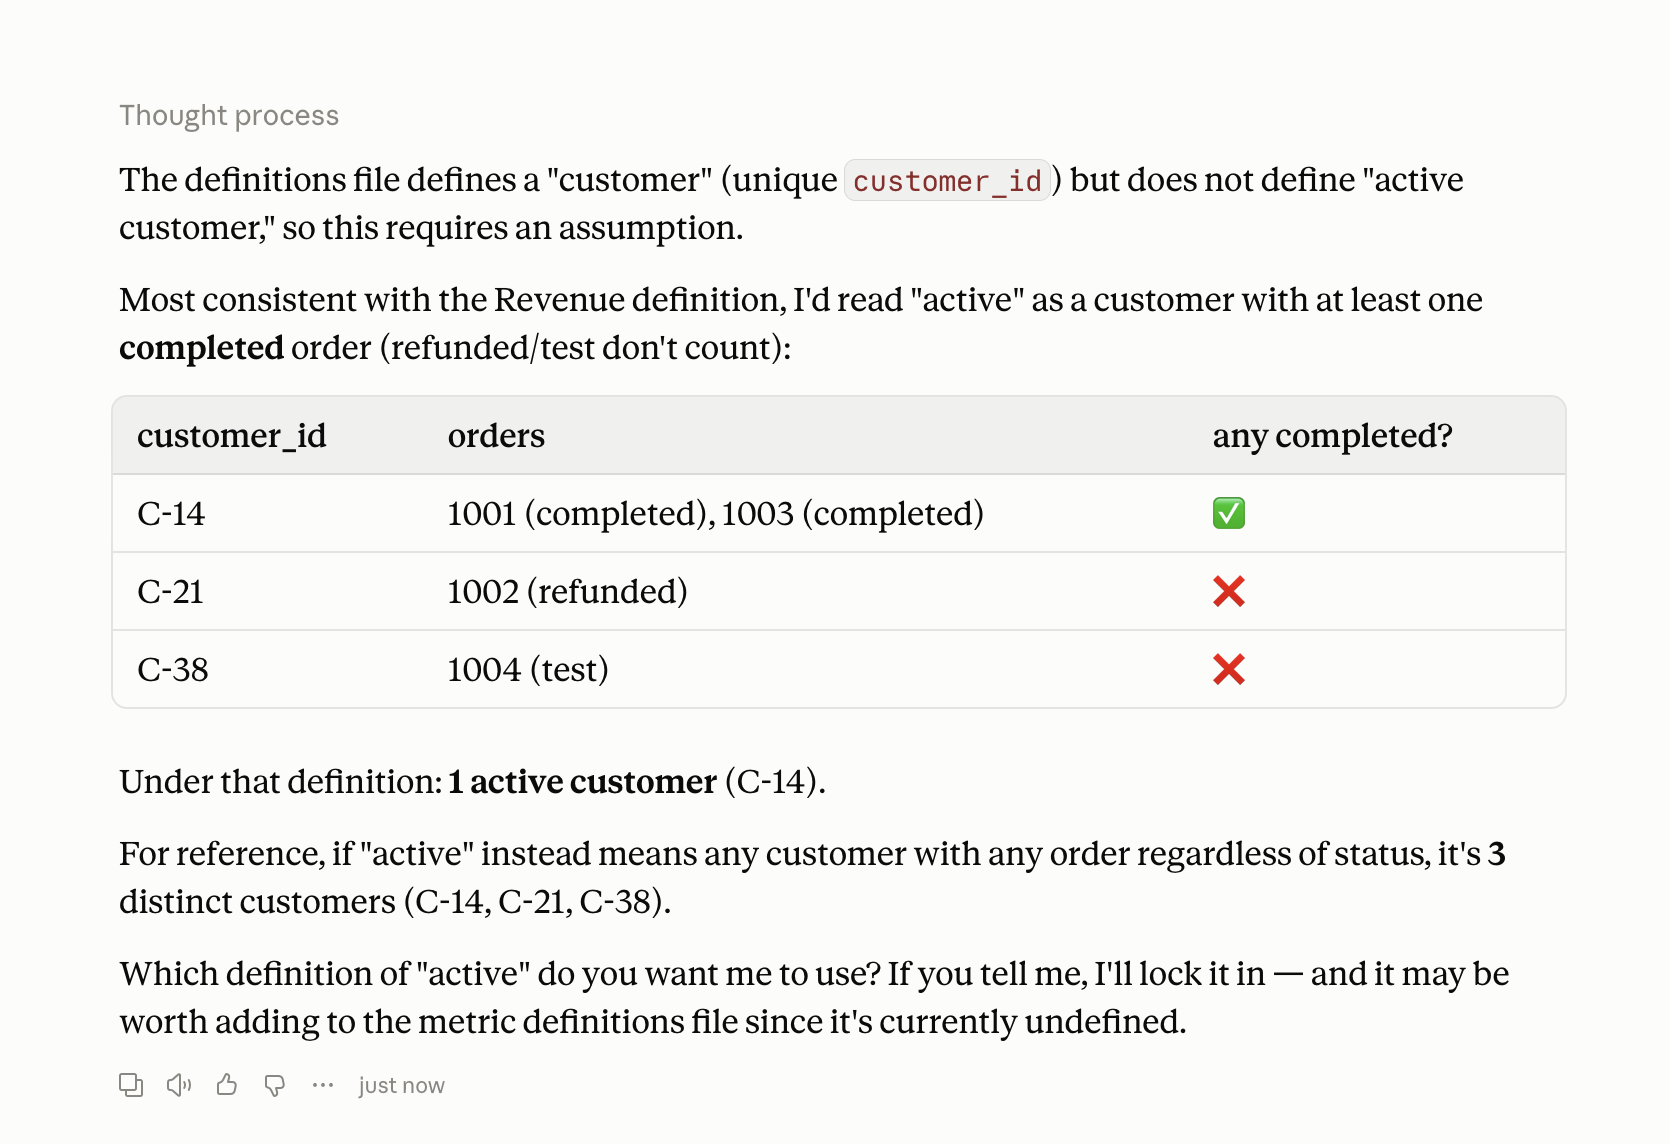
How many active customers did we have?
The project knows what a customer is. It does not know what "active" means, because nobody wrote it down. Instead of quietly picking a definition and handing you a confident, unaccountable number, Claude flags the gap. It points out that "active" is undefined, proposes the reading most consistent with your Revenue definition (a customer with at least one completed order, which here is one customer), shows what the count would be under a looser reading, and asks you to decide.
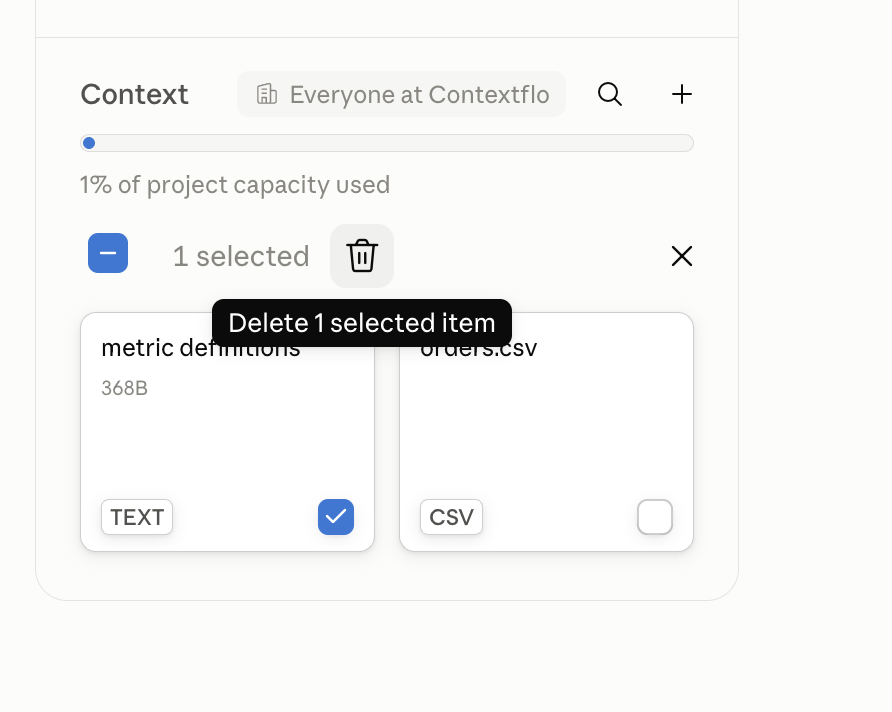
So you make the call and add it to the definitions. In a Claude Project the text you added earlier is replaced rather than edited in place: go back to the project and delete the existing definitions item.
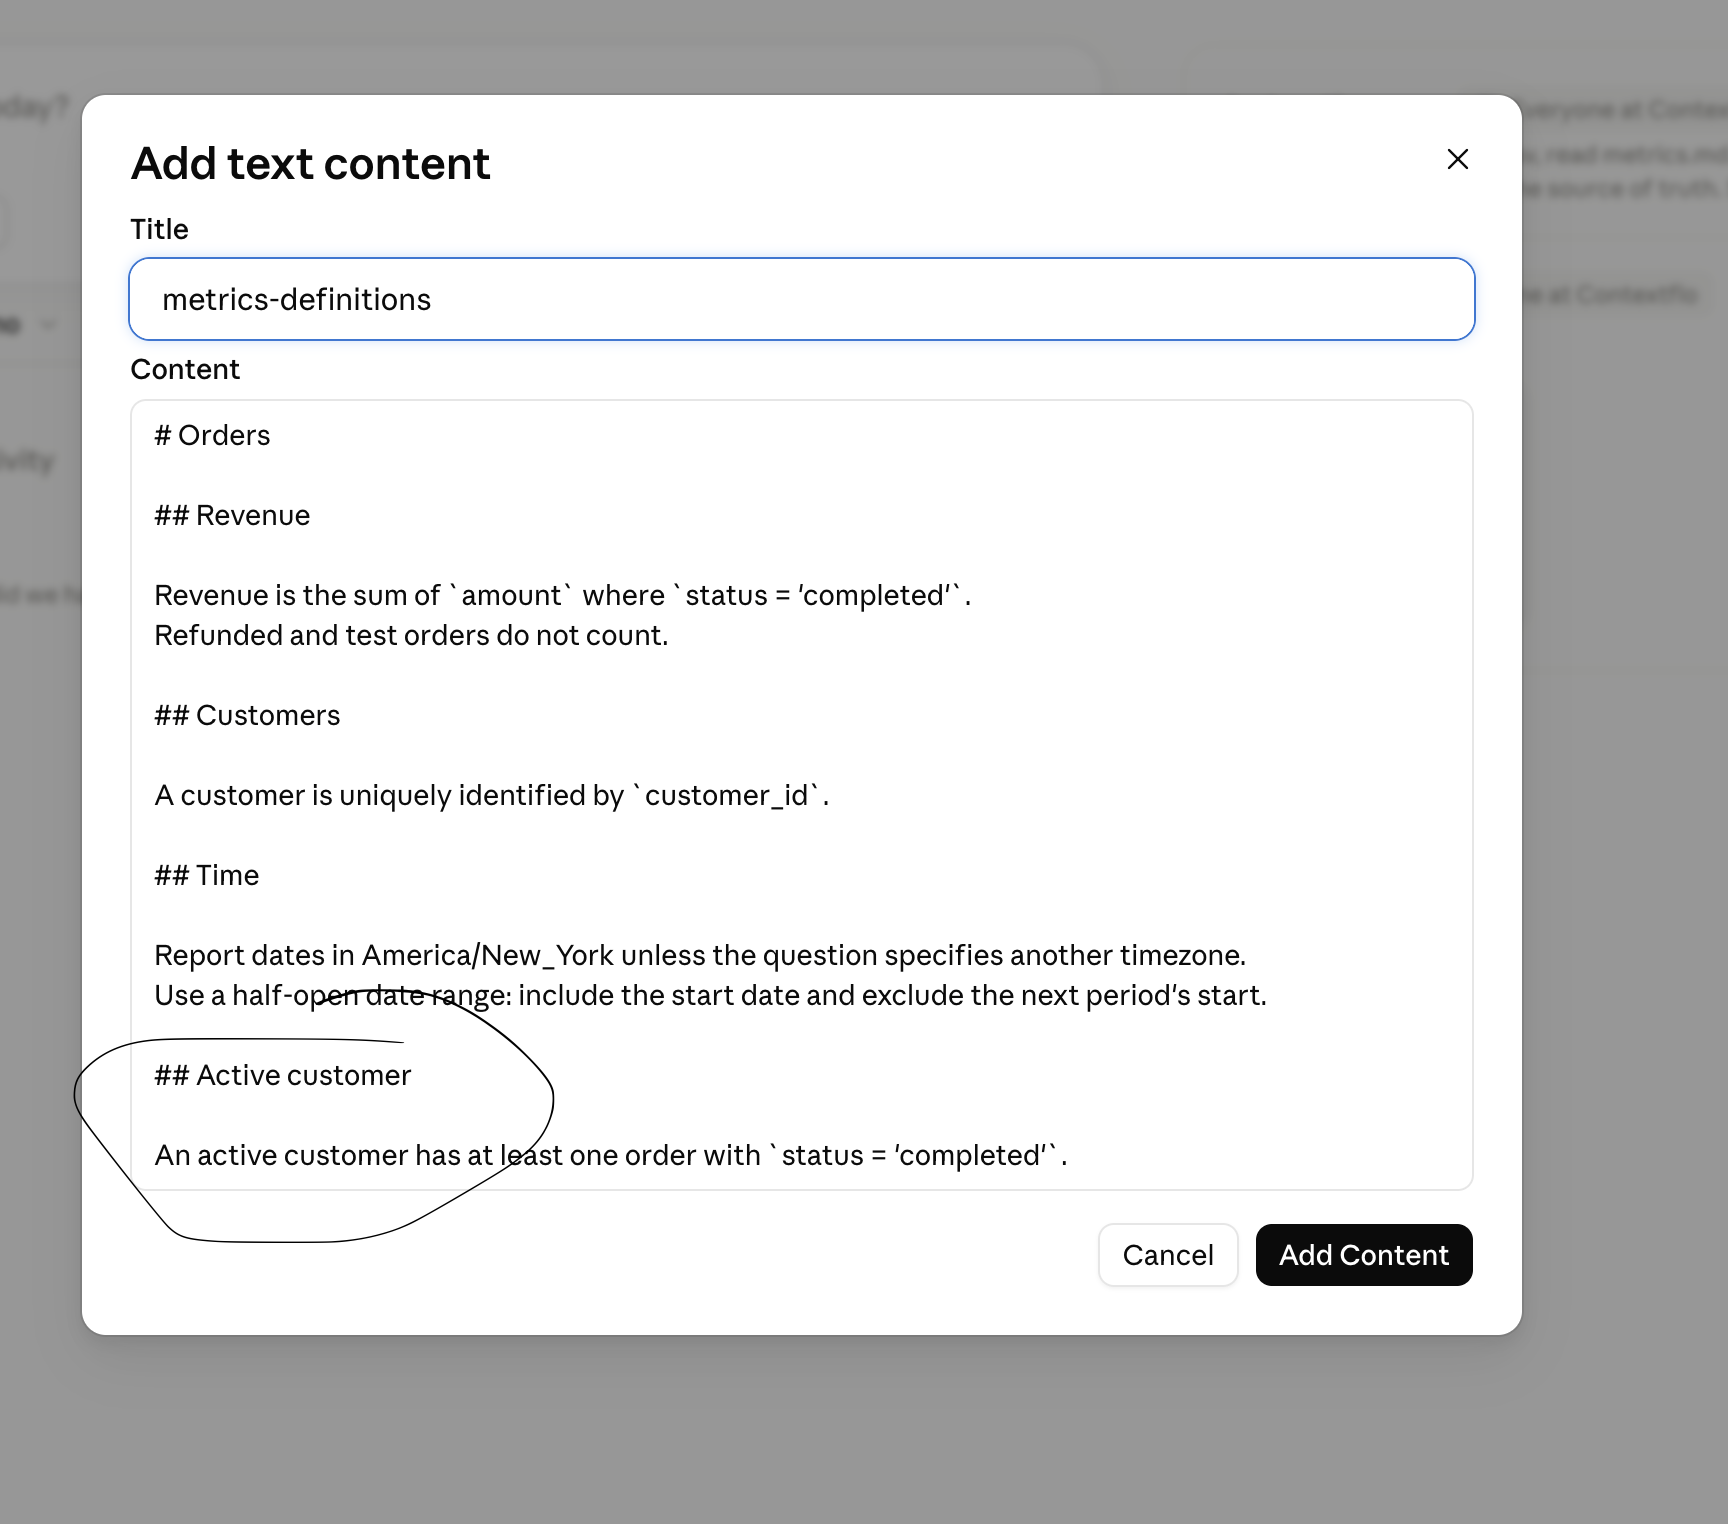
Then add it back with one section appended:
## Active customer

An active customer has at least one order with `status = 'completed'`.
Ask the same question again and there is nothing left to assume. Claude answers with the rule you just set, and every future "active customers" question, from anyone, resolves the same way.
1 active customer (C-14). By the definition you just wrote, an active customer has at least one completed order: C-14 has two (orders 1001 and 1003), C-21 is refunded and C-38 is a test, both excluded.
No assumption flagged this time. And it names what it used, the Active customer definition and orders.csv, so anyone can check the count against the rule rather than take it on faith.
That loop, a real question exposing a missing definition and then closing it, is how these get built in practice: not in one big modeling project, but one argument-settling definition at a time.
That is a working semantic layer. The same question now means the same thing every time anyone asks it.
Is a markdown file really a semantic layer?
For this one-person experiment, yes. It performs the essential job: translating business language into query logic before the data is analyzed.
A traditional BI architect may call it semantic context rather than a complete semantic layer. That is also fair. The definitions are instructions to Claude, not rules enforced by a query compiler. Another prompt could ignore them, and nobody else automatically receives an update.
The distinction matters when the result leaves your hands. For an MVP, the file proves the concept without making you install a platform first.
Where did semantic layers come from?
The term predates AI by decades. BusinessObjects made the idea mainstream in business intelligence in the 1990s through its “Universe.” A Universe mapped database structures to business objects so people could build reports using familiar terms. SAP still defines a Universe as metadata that lets users analyze data in business language regardless of the underlying structure.
Looker modernized the idea with LookML. Metrics, dimensions, calculations, and relationships became model files that could be reviewed in Git and reused to generate SQL. Looker's documentation describes LookML as the language behind its semantic data models.
Later systems separated the layer from any single BI interface so several tools could use the same definitions. AI agents are simply the newest consumer. They still need someone to explain what revenue means.
Where this goes next: the other ways to hold definitions
The file you just built is the smallest of several ways to keep the meaning of your numbers in one place. The others trade more setup for wider reach and real enforcement. Think of it as where you keep the recipe book for your company's numbers, and who is allowed in the kitchen.
| Approach | Where the definitions live | Best when |
|---|---|---|
| Markdown file + Claude Project | A file you upload | One person proving the idea (what you just did) |
| Looker / LookML | Inside Looker | Looker is already the center of your analytics |
| dbt Semantic Layer | Beside your dbt models | Your team already models data in dbt |
| Cube | A separate code-first service | You need APIs, caching, or embedded analytics |
| Warehouse-native model | Inside one warehouse | Most of your data and people live on one platform |
| Contextflo | Generated, human-reviewed, served over MCP | A team wants governed answers inside Claude or ChatGPT, across sources |
The reasoning behind each, and whether a formal layer is worth it for you at all, is the whole subject of Does text-to-SQL need a semantic layer?. The short version: pick the smallest one that solves the coordination problem you actually have, and no bigger.
How do you scale this for a team?
Your 20-minute layer works because one person controls the files, the questions, and the review. A team version needs three additions.
Host the definitions somewhere shared
Move metrics.md into one canonical home: a Git repository, metadata service, or database-backed application. A shared Claude Project can work inside one Claude organization, but it does not automatically serve other agents and applications.
Every important definition also needs an owner. “Revenue” should not change because the last person to edit the file preferred another interpretation.
Connect the layer to live data
Replace the uploaded CSV with a read-only connection to the database, warehouse, or API. Keep the business definition separate from the storage details. amount and status describe columns. “Revenue excludes refunds” describes the company.
Make the definitions and data accessible to the agent
The agent needs to retrieve the relevant definition, inspect the allowed schema, and run a query. You can build a separate integration for every AI client, or expose those capabilities through MCP.
What is an MCP semantic layer?
Model Context Protocol is an open standard that connects AI assistants to external data sources and tools.
“MCP semantic layer” is useful shorthand, not a separate standard inside MCP. It means the definitions and query capabilities are available through an MCP server. That server might let an agent:
- list the tables available to the current user;
- retrieve column descriptions and table relationships;
- fetch the approved definition of revenue;
- find a verified question and its known-good query; and
- execute SQL against live data.
Person
  ↓
Claude or ChatGPT
  ↓ MCP
Definitions + schema context + verified queries
  ↓
Live database, warehouse, or API
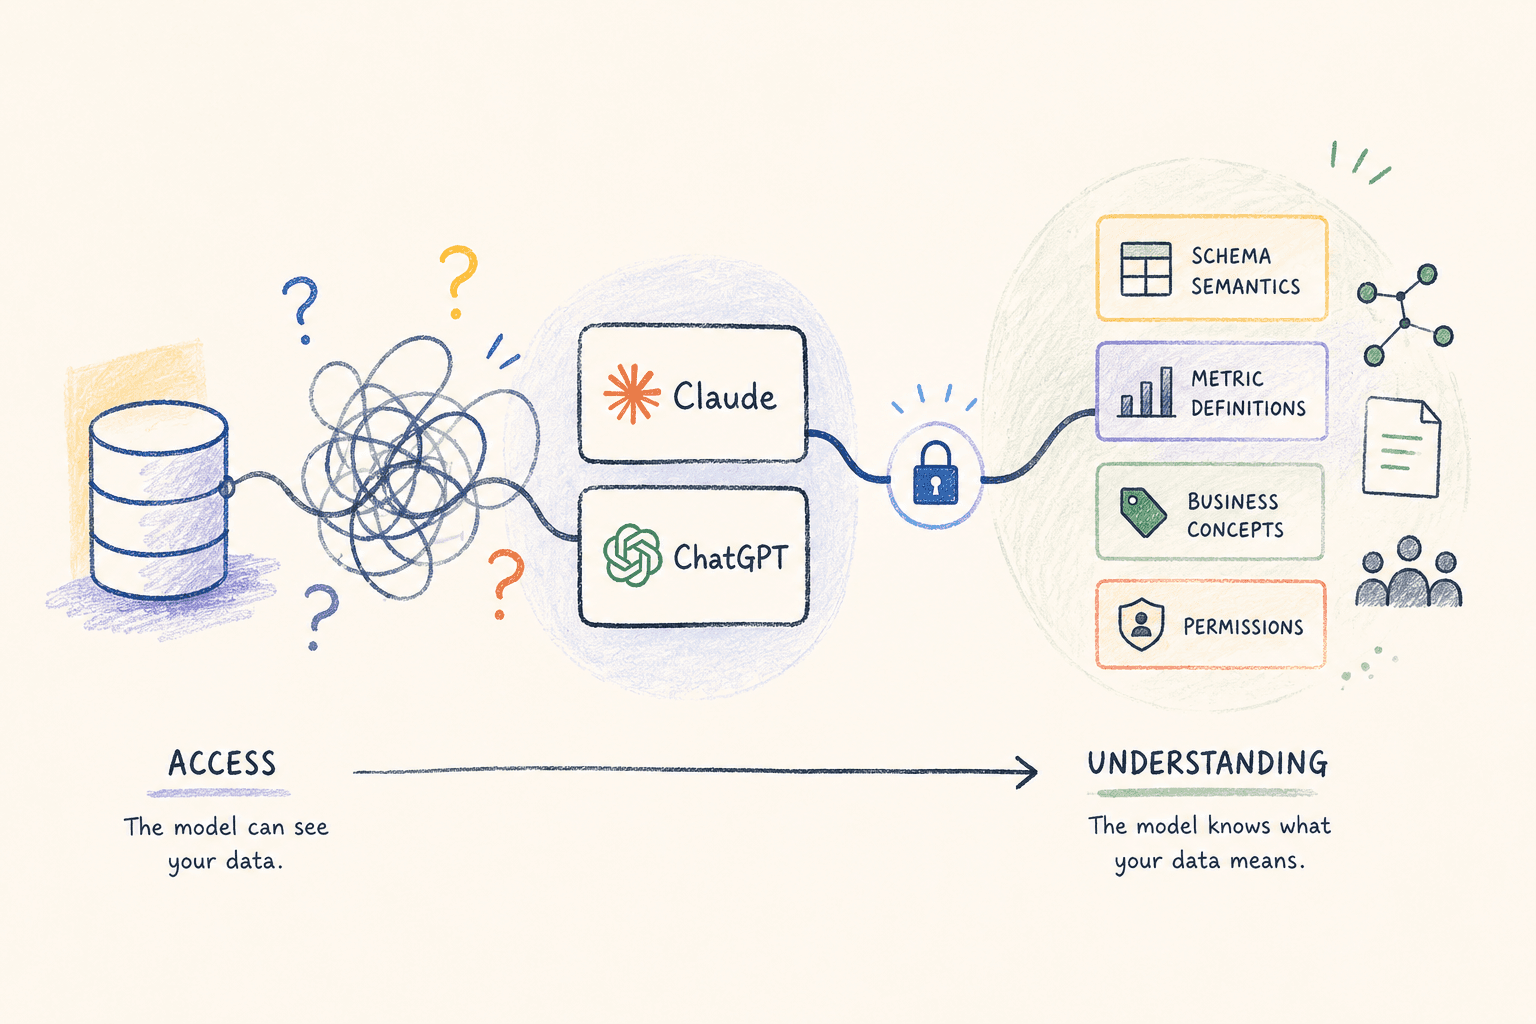
MCP is relevant because the same layer can be available to several compatible agents. A raw database MCP server is not automatically a semantic layer. If it only exposes execute-query, the model can reach the data but still has to guess what the data means.
Why is MCP still not enough?
MCP solves the connection. It does not decide how your company governs that connection.
Access control
A shared read-only credential can still expose every readable table to every employee. The server must identify the person asking and enforce that person's permissions when the query runs. Removing a table from the prompt does not prevent the model from querying it.
Visibility
When someone challenges a number, an administrator needs to see who asked, which definition the agent retrieved, what SQL ran, which source it queried, and whether it failed. Without that trail, you cannot tell whether the definition, the query, or the access policy was wrong.
Maintenance
Schemas and business rules change. Give every important metric an owner, keep its edit history, and test a small set of known questions after changes. Human review remains necessary. A system that automatically learns every correction also learns every mistake.
Multiple data sources
If revenue lives in Stripe, product usage lives in Postgres, and campaign spend comes from an API, the layer must tell the agent where each concept lives. It also needs shared entity definitions, currency and timezone rules, and honest boundaries around which sources can be joined in one query.
From zero to 100
| Level | What you have | Who it fits |
|---|---|---|
| 0 | CSV + metrics.md + one Claude Project | One person proving the idea |
| 25 | Hosted definitions + live read-only data | A technical team using one source |
| 50 | MCP context and query tools | Several agents using the same meaning |
| 75 | Per-user access control + query audit | Non-technical employees using it safely |
| 100 | Owners, history, tests, and source boundaries | A company operating across several sources |
Do not start at 100 because someone on LinkedIn said you need a semantic layer. Start with one metric whose definition keeps causing arguments. Write it down, ask a real question, and add the next layer only when the current one breaks.
Frequently asked questions
What is a semantic layer in simple terms?
A semantic layer is a shared set of instructions that explains what your data means. It defines business terms such as revenue, maps them to columns and filters, records how tables relate, and gives every person or AI agent the same starting point for a query.
Can I build a semantic layer without a dedicated tool?
Yes. For one person testing the idea, a CSV and a markdown file containing metric definitions are enough. Put both in a Claude Project, ask a question, and inspect the calculation. Dedicated infrastructure becomes useful when several people, agents, or live data sources need the same definitions.
What is an MCP semantic layer?
An MCP semantic layer exposes definitions, schema context, verified queries, and data-query tools to AI agents through the Model Context Protocol. The phrase is useful shorthand, not a separate MCP standard.
Is an MCP server enough for a team semantic layer?
No. MCP makes context and tools accessible to agents, but the server still needs per-user access control, query logs, definition ownership, change review, and clear boundaries between data sources.
Which semantic layer approach should I use?
Start with a markdown file for one person. Use LookML when Looker is already your analytics home, dbt Semantic Layer when your metrics belong in an existing dbt project, Cube when you need a code-first layer for BI or embedded analytics, and Contextflo when a team needs generated context, governed data access, and the same definitions inside Claude or ChatGPT through MCP.
When you outgrow the file
Keep the CSV and markdown version if it solves the problem. Contextflo starts at the team stage: it connects live data, generates a first draft of context from schemas, code, and docs, exposes definitions and query tools over MCP, and applies table-level access for each user when a query runs.
See it on your own data.
Connect your warehouse and your team can ask Claude about it the same day, without waiting on a data team. Want a walkthrough first? Grab 20 minutes.
Book a 20-minute callSee how teams use Contextflo

Related posts
Keep reading
Conversational analytics: 5 ways to set it up, compared
7 min read
How to connect Claude to BigQuery? What works and what doesn't in 2026
8 min read
How to connect Claude to Postgres without giving it write access
9 min read

How to build a BI dashboard with Claude that your team can actually trust
8 min read
How to give Claude read-only access to your database (it isn't always the default)
7 min read
You connected your warehouse to Claude, now what?
5 min read
ClickHouse MCP: how to connect ClickHouse to Claude, Cursor or Codex
6 min read
Query BigQuery from the Codex CLI with MCP
5 min read
Run ClickHouse queries from Codex with MCP
6 min read