Why is the team missing sprint goals? How to analyze Jira data with AI
Hi, this is Vivek, building Contextflo. I share practical notes on getting answers from your data, a couple of times a month.
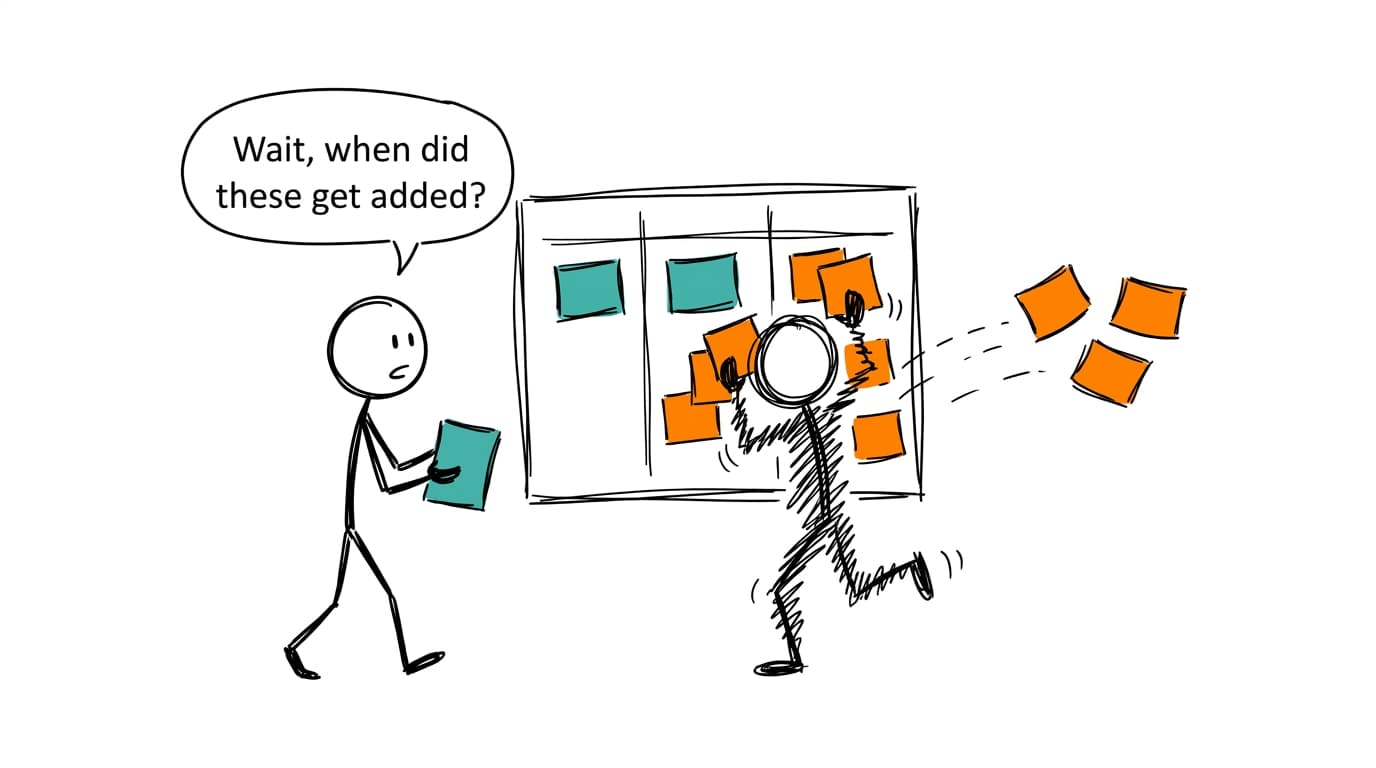
Most missed sprint goals come from the sprint changing after planning, not from the team working slowly. To find out which one you have, look past velocity: count the work added after the sprint started, the share of finished work that was unplanned bugs or escalations, and how long issues waited in review or sat blocked. Then check carryover and how far estimates missed. Jira already records all of it in each issue's status history. Once you have that history in front of Claude, the question "why did we miss?" usually has a boring, fixable answer.
Velocity can go up while delivery stays flat
Velocity is the number every sprint review opens with, and it's the easiest one to fool without anybody trying.
Story points are estimated by the same team whose output is measured in them. Over a few quarters, a task that was a 3 quietly becomes a 5, because everyone remembers the last one that ran long. Nobody is gaming anything, but velocity rises and the amount of shipped work doesn't. Carryover adds a second distortion. An issue that slips out of one sprint and closes early in the next shows up as a miss, then as a win, and the points land in whichever sprint happened to be open when it closed.
So velocity is fine for deciding how much to pull into the next sprint. It just can't tell you why the last one missed, because it only counts what finished and says nothing about what happened along the way.
What actually explains a missed sprint
The signals below come from two places: what went into the sprint, and what happened to the work once it was in.
The sprint changed under the team
Scope added mid-sprint is the first thing to check. Jira's own sprint report marks issues added after the sprint started with an asterisk, and it shows estimates that changed during the sprint.[1] Add up the points or issues with that mark and compare them to what was committed at planning. A team that committed 40 points and had 15 more added has a planning problem, and the team's pace has little to do with it.
Unplanned work is the second. Bugs, support escalations and "can you just" requests often skip planning entirely. Measure them as a share of everything finished in the sprint, by issue type or label. If a third of completed work was never on the board at planning, the sprint goal was written for a sprint that didn't happen.
The work got stuck
Cycle time by stage shows where issues wait. Split each issue's life into stages, such as in progress, in review and done, and take the median time in each. A long "in review" stage with a short "in progress" stage means work is finished and waiting for someone. That's a very different conversation from slow development.
Time blocked is worth its own line, whether your workflow has a Blocked status or uses a flag. A few issues blocked for most of a sprint by another team or a vendor can sink a goal on their own.
Work in progress per person is the quiet one. When each engineer has four issues open at once, everything moves a little and nothing finishes. High WIP usually shows up alongside rising cycle time.
The plan was off
Carryover rate is the share of committed issues that didn't finish and moved to the next sprint. A little, every sprint, is normal. A rate that climbs sprint after sprint says the team keeps committing to more than fits.
Estimate accuracy compares the estimate with what happened, either points against cycle time or original estimate against time logged if your team logs time. You're looking for patterns, like integration work that always runs long or frontend tickets that always land early, not for anyone's personal hit rate.
Comparing teams without building a leaderboard
Once these numbers exist, someone will want to rank teams by them. Resist it. Points aren't comparable across teams, and neither is the work: a platform team fielding incidents will always have more unplanned work than a team building a new feature behind a flag.
Compare each team with its own last six sprints instead. Stick to measures that don't depend on points, like carryover rate, added-scope share, unplanned share and cycle time per stage. When one team's numbers look worse, the first question is what's different about the work it receives. Usually the answer is an interrupt load that belongs in planning, and the team was never the problem.
Look outside Jira too
Some of the most useful answers need data Jira doesn't hold. Tie issues to releases through fix versions or deploy dates, and you can see whether a release was followed by a wave of bugs. Tie bugs to incidents, and you can see which parts of the system keep pulling the team off plan. Tie them to customer support tickets, and you learn which bugs customers actually felt. If you're already grouping tickets by theme, finding the patterns in Zendesk or Intercom tickets gives you the other half of that join.
Getting Jira data in front of Claude
Atlassian makes its own connector for Claude, listed as Anthropic verified. It works across Jira, Confluence and other Atlassian apps, and can search and summarize issues as well as create and edit them.[2] Every action runs with your existing Atlassian permissions, your admin controls which read, write and delete operations are available in the Rovo MCP server settings, and each tool call is recorded in your organization's audit log.[2] Atlassian's documentation covers setup for Claude Desktop and Claude Code.[3] For "what's the status of this epic" or "summarize what's blocked right now," it's the quickest route.

For sprint history across many sprints, you need status history. JQL can find issues by their past, with operators like WAS and CHANGED, for example status CHANGED FROM "In Progress" TO "Open".[4] The full timeline with timestamps lives in each issue's history, and the Jira REST API returns it as the issue's changelog, oldest change first.[5] Export issues with their sprint, type, labels, story points, created and resolved dates, and the status changes with timestamps. Then upload it to a Claude chat, and check Anthropic's current file limits if the export is big.[6]
With Contextflo
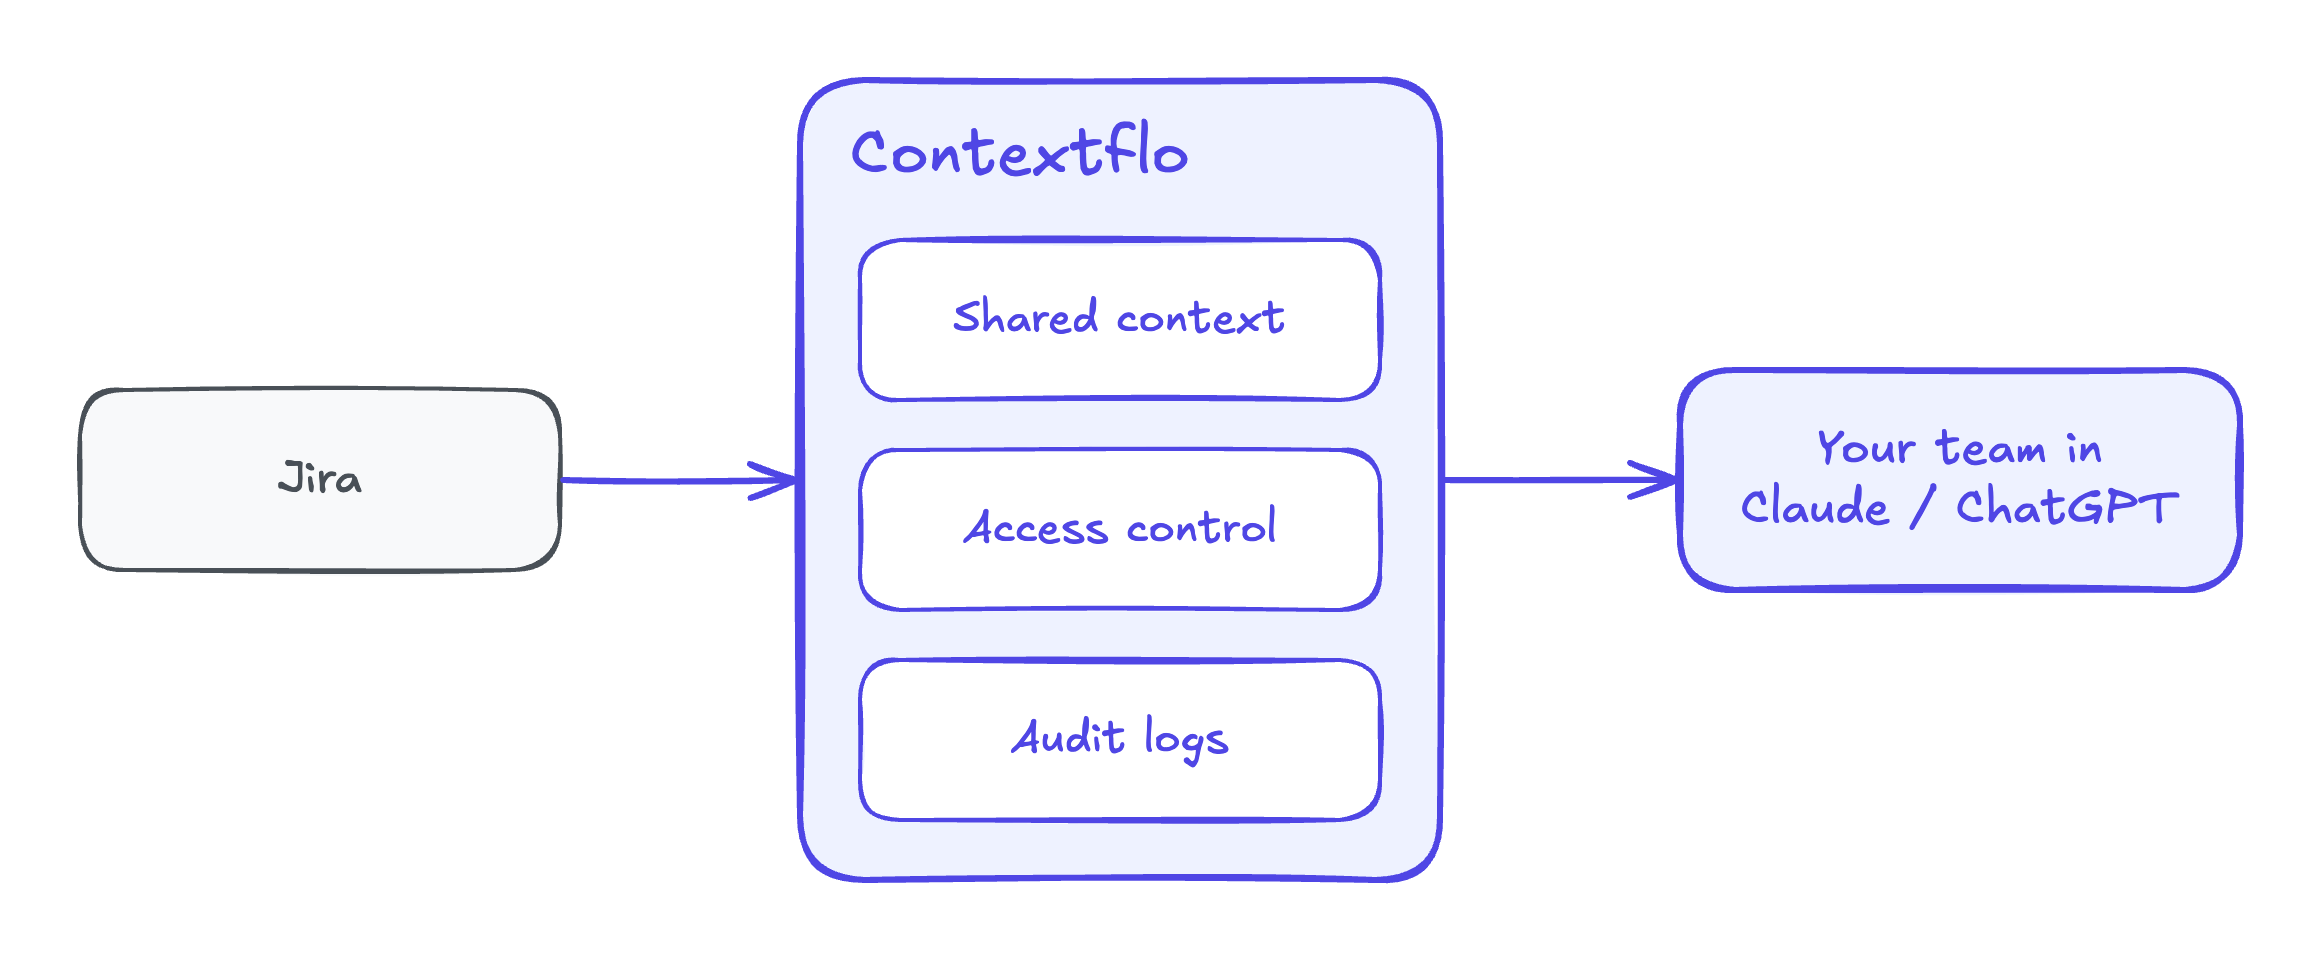
Connect Jira to Contextflo and the whole team can ask about sprints in Claude, with the same definitions behind every answer. Save what counts as unplanned work, what "done" means, which statuses count as active and which count as blocked, and an engineering manager and a head of product will get the same carryover number for the same sprint. Jira sits next to your support tickets, incident log and product data, so "which bugs generated the most tickets" is a single question. If you run more than one Jira site, connect each one and ask across them side by side.
Get in touch and we'll set up the Jira connection with you. Book 20 minutes.
Prompts to copy
Start with where the sprint changed after planning.
For the last 6 sprints, show per sprint: points and issues committed at
sprint start, points and issues added after the start, points and issues
removed, completed, and carried over to the next sprint. Calculate the
added-scope share and the carryover rate. Put issue counts next to every
point total.
Then find where issues wait.
Using the status history, calculate time each issue spent in each status
for issues resolved in the last 6 sprints. Group statuses into stages:
To Do, In Progress, In Review, Blocked, Done. Show the median and 80th
percentile per stage, per sprint, and flag any stage whose median grew
by more than half.
Measure the work nobody planned.
Treat bugs, and any issue with the label "escalation" or "support", as
unplanned work. For each sprint, show unplanned issues completed as a
share of all completed issues, and how many of them were added after the
sprint started. List the 10 unplanned issues with the longest cycle time.
Count blocked time.
For the last 3 sprints, list every issue that was in Blocked status or
flagged at any point. Show total time blocked, who or what it was waiting
on from the comments, and whether it finished in the sprint.
Bring in customer tickets.
Match Jira bugs to support tickets by linked issue key, or by ticket
text mentioning the bug. For bugs created in the last 90 days, rank them
by number of tickets and distinct customers. Show the release each bug
appeared after, and how many sprint days went into fixing it.
I'd read the first one before running the rest. If a third of the work arrived mid-sprint, that's the story, and the others mostly fill in detail.
Worked example: the team that wasn't slow
The numbers here are illustrative. A six-person product team missed three sprint goals in a row. The retro kept landing on "we need to move faster," and velocity had slipped from around 40 a few months earlier to 34.
Here's the sprint breakdown:
| Sprint | Committed | Added mid-sprint | Of which bugs and escalations | Completed | Carried over |
|---|---|---|---|---|---|
| 21 | 38 | 6 | 4 | 36 | 8 |
| 22 | 40 | 14 | 11 | 35 | 19 |
| 23 | 39 | 17 | 13 | 34 | 22 |
The team completed roughly the same number of points each sprint. What changed was how much arrived after planning. By sprint 23, 17 points came in mid-sprint, most of them bugs and customer escalations, and they went to the front of the line. The committed work was what slipped, so carryover more than doubled.
Cycle time confirmed it. The median time in progress held steady at about two days across all three sprints. Time in review crept up a little, because the same two senior engineers were fixing bugs and reviewing everyone else's work. Nothing suggested people were working slowly.
Matching the bugs to support tickets finished the picture. Nine of the mid-sprint bugs in sprints 22 and 23 traced back to one release early in sprint 22, to a reworked import flow. Those nine bugs accounted for most of the related tickets that month.
What changed:
- The team now holds back a fixed share of each sprint for unplanned work, sized from the last six sprints.
- Bugs from a release get triaged the week after it ships, before the next planning meeting.
- A second reviewer was added to the rotation, so bug duty doesn't stall reviews.
The next sprint hit its goal with a velocity of 33. The number went down, and the team shipped what it said it would.
FAQ
Why does my team keep missing sprint goals? Usually because the sprint changed after planning, not because the team worked slowly. Check how many points or issues were added after the sprint started, what share of finished work was unplanned bugs or escalations, and how long issues sat waiting for review or blocked. If those numbers are high, the fix is in how work enters the sprint. If they're low and issues still spend a long time in progress, the problem is in the work itself or the estimates.
Is velocity a good measure of team performance? Not on its own. Story points are set by the team that's measured by them, so they drift upward over time, and carryover lets the same work be counted in a later sprint. Velocity is useful for planning the next sprint. To understand a missed goal, look at scope added mid-sprint, carryover rate, cycle time by stage and the share of unplanned work instead.
How do I calculate cycle time by status in Jira? You need the status history of each issue, not just its current status. Jira keeps it in the issue's history (the changelog), which the Jira REST API returns with a timestamp for every status change. Subtract consecutive timestamps to get time spent in each status, then group statuses into stages like in progress, in review and blocked, and take the median per stage.
Can Claude analyze Jira data? Yes. Atlassian makes its own connector for Claude, listed as Anthropic verified, which can search and summarize Jira issues and create or update them within your existing permissions. For sprint history across many sprints, you can also export issues with their status history and upload the file to Claude.
How do I compare sprint performance across teams fairly? Compare each team against its own history rather than against each other. Points mean different things on different teams, so use measures that don't depend on them: carryover rate, the share of work added mid-sprint, the share that was unplanned, and median cycle time per stage. Then ask what's different about the work a team receives before drawing conclusions about the team.
Find out if Contextflo is the right fit for you.
See how teams use Contextflo

Related posts

Keep reading
Conversational analytics: 5 ways to set it up, compared
7 min read
How to connect Claude to BigQuery (and fix the errors you'll hit)
8 min read

How to connect Claude to Postgres (and keep it read-only)
7 min read

How to build a BI dashboard with Claude that your team can actually trust
8 min read

How to give Claude read-only access to your database (it isn't always the default)
7 min read
You connected your warehouse to Claude, now what?
5 min read
Why we built our own Postgres MCP server
7 min read

Which closed deals churned within a year? How to connect HubSpot and Stripe with AI
8 min read
Is your retention improving? How to run a cohort analysis with AI, no SQL
8 min read