Are my ads actually profitable? How to analyze Facebook and TikTok ads together with AI
Hi, this is Vivek, building Contextflo. I share practical notes on getting answers from your data, a couple of times a month.
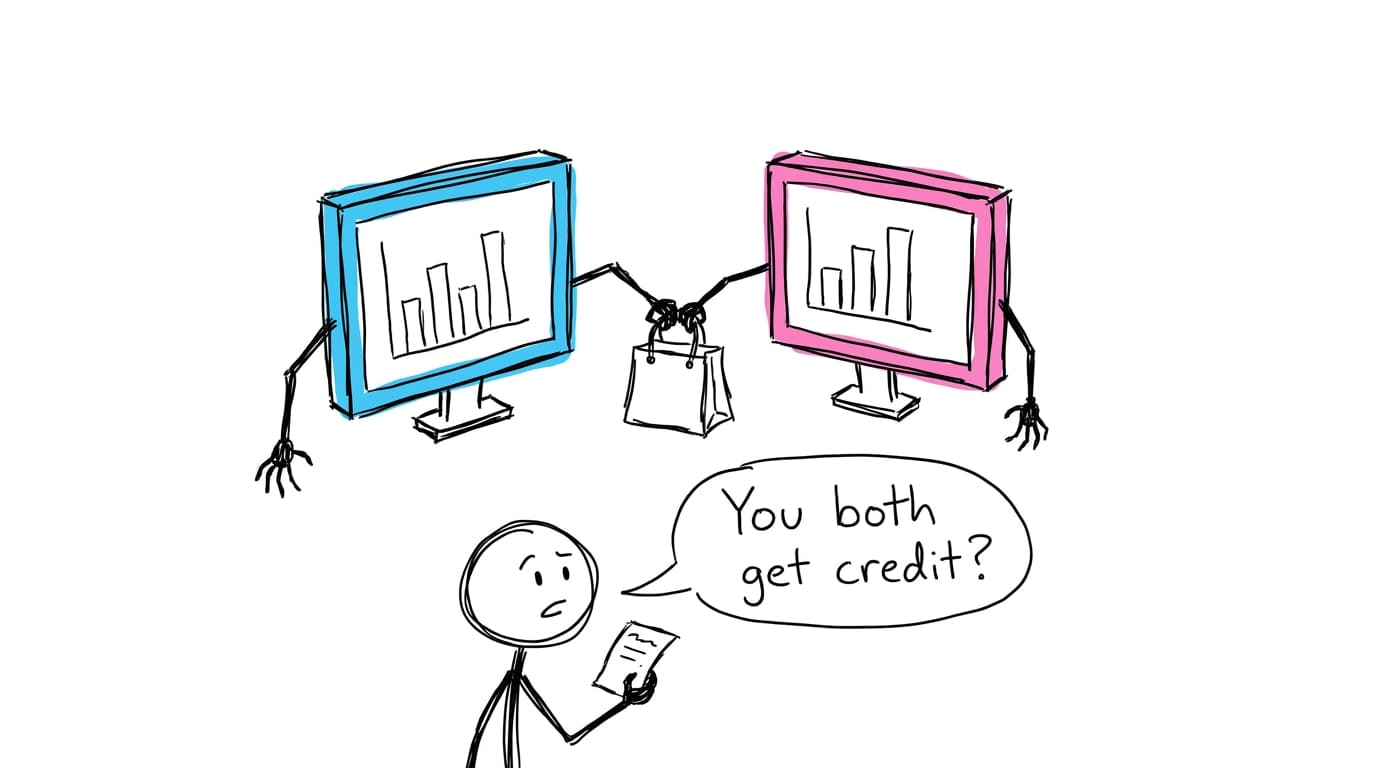
Your ads are profitable if the money your store actually took in, minus what it cost to make, ship and refund those orders, is bigger than what you spent on ads. Ads Manager can't tell you that. Meta and TikTok each report revenue before any costs, each credit themselves for sales the other one also claims, and neither knows your margin. So the check happens outside both dashboards: work out your break-even ROAS from contribution margin, compare it to blended ROAS (total revenue over total ad spend), and only then look at which platform deserves the credit.
ROAS is revenue, not profit
A 3x ROAS sounds great until you learn that the product costs 45% of its price, shipping eats another 8%, and one order in ten comes back. What you need is contribution margin: revenue after the costs that scale with each order.
| Line | What goes in it | Where it lives |
|---|---|---|
| Net revenue | Order revenue minus discounts, refunds and returns | Shopify orders export |
| Cost of goods | What you paid for each unit sold | Shopify's cost per item field, or your own cost sheet |
| Shipping and fulfillment | Postage, packaging, 3PL pick and pack | Your shipping app or 3PL invoice |
| Payment and platform fees | Card processing, marketplace or app fees | Your payment processor's payout report, app invoices |
| Contribution before ads | Net revenue minus the three cost lines | You calculate it |
Divide contribution before ads by gross order revenue (the same revenue the ad platforms report, so the two numbers compare) and you have your margin share. Break-even ROAS is 1 divided by that share. Keep 40 cents of every dollar and you break even at 2.5. Keep 25 cents and you need 4.0. Every ROAS number you look at afterward means something only next to this one.
Why Meta and TikTok both over-claim
Each ad platform counts a sale as its own if it happened inside its attribution window. That window usually includes sales some days after a click, and on both Meta and TikTok it can include view-through conversions: people who saw the ad, didn't click, and bought later. The exact window is a setting on each ad account, so check it in both before comparing anything.
The platforms also can't see each other. Someone watches a TikTok video on Monday, clicks a Meta retargeting ad on Wednesday and buys. TikTok counts a view-through conversion, Meta counts a click-through conversion, and your store recorded one order. Add the two dashboards together and you've sold that jacket twice.
That's why the useful numbers sit on the store side:
- Blended ROAS, or MER: total store revenue divided by total ad spend across every platform. Attribution can't inflate it. It tells you whether ads work as a whole, and nothing about which platform.
- Platform-reported revenue vs actual orders: add up what each platform claims and set it next to what Shopify recorded. The gap is the double counting, plus sales from email, organic and returning customers that ads took credit for.
- Orders by UTM source: a last-click view from your own order data. It under-credits TikTok and other view-heavy channels, so treat it as the floor and platform numbers as the ceiling.
The quick way: three exports and a Claude chat
You can do the whole check this afternoon with files you already have.
- Export Meta. In Ads Manager, build a campaign report by day or week with spend, purchases and purchase value, and export it as CSV. Note the attribution setting it uses.
- Export TikTok. In TikTok Ads Manager, pull the same columns for the same dates and export.
- Export Shopify orders for the same period, as CSV. Keep the UTM or referring-source columns if you have them.
- Add a small cost sheet if Shopify's cost per item is empty or incomplete: product, unit cost, average shipping cost, and your payment fee rate.
- Upload everything to a Claude chat, or put it in a Google Sheet and link it through Claude's Google Drive connector.[1][2]
Then ask in steps, so each answer can be checked before the next one builds on it:
Using the Shopify orders file and the cost sheet, calculate net revenue,
cost of goods, shipping, payment fees and contribution before ads for
each week. Then give me my break-even ROAS. Show the arithmetic.
Add the Meta and TikTok exports. For each week, show spend and reported
revenue per platform, the sum of both platforms' reported revenue, and
Shopify net revenue. Calculate MER (Shopify revenue / total spend) and
compare it to break-even ROAS.
Using the UTM source on each Shopify order, split revenue into Meta,
TikTok, email, organic and direct. Put that next to each platform's own
reported revenue and show how much the platforms claim beyond what
Shopify credits them.
Where it runs out
Claude caps how many files a chat can hold and how large each one can be, so check Anthropic's current upload limits before you plan around it[1], though it usually covers months of data for most stores. The limits are elsewhere. The files are a snapshot, so next week you export all four again. Claude re-derives "net revenue" each time and may treat partial refunds or cancelled orders differently from last time unless you paste the definition in. And an export only has the attribution setting it was pulled with, so if someone changes the window in Ads Manager, this month stops matching last month without anyone noticing.
Connect it once with Contextflo
Connect the Google Sheet with your costs to Contextflo once, and Claude or ChatGPT can read it directly from then on, no re-uploading. Upload the Meta, TikTok and Shopify exports next to it, and add your warehouse too if you have one.
The part that saves the most time is writing the definitions down once. Tell the agent what "contribution margin" and "MER" mean for your store, including how refunds and shipping count, and every later question uses the same formula instead of a fresh guess.
Share that setup with the team, and whoever asks next week gets the same margin math you'd get, not a different guess at what "net revenue" means.
Checking every week? Put it in a warehouse
When this becomes a weekly habit, move the data somewhere that updates itself. Fivetran has Facebook Ads, TikTok Ads and Shopify connectors.[3][4][5] Airbyte, which also has a free open-source version, has Facebook Marketing, TikTok Marketing and Shopify sources.[6][7][8] Both load into BigQuery, Snowflake or Postgres on a schedule. Once the data lands, note which attribution setting it was pulled with, so next quarter's numbers are compared on the same basis.
Then point Claude at the warehouse directly, as in Claude with BigQuery, or through Contextflo so the margin and MER definitions are shared across the team. A cost sheet that never makes it into the warehouse can still live in Google Sheets, as in connecting Google Sheets to Claude.
An example: two dashboards, one month
The numbers below are made up for illustration. A skincare store spends $30,000 in a month: $20,000 on Meta and $10,000 on TikTok.
| Question | Answer | What it tells you |
|---|---|---|
| What do the platforms claim? | Meta: $70,000 revenue (3.5 ROAS). TikTok: $32,000 (3.2 ROAS). Together, $102,000. | Both look healthy on their own dashboards. |
| What did Shopify record? | $110,000 in orders. By UTM: Meta $48,000, TikTok $14,000, email, organic and direct $48,000. | The platforms claim $102,000 of sales that UTMs split very differently. At least $40,000 is counted twice or taken from other channels. |
| What's left after costs? | Refunds $8,000, cost of goods $44,000, shipping $9,000, payment fees $3,300. Contribution before ads: $45,700. | $45,700 / $110,000 is a margin share of about 41.5%, so break-even ROAS is about 2.4. |
| Are ads profitable overall? | MER is $110,000 / $30,000, about 3.7. Contribution after ads: $15,700. | Yes. Ads as a whole clear break-even comfortably. |
| Is each platform? | Meta: 3.5 claimed, 2.4 by UTM. TikTok: 3.2 claimed, 1.4 by UTM. | Meta clears break-even on its own numbers and roughly matches it by UTM. TikTok is profitable only if you believe its own dashboard. |
The answer to "are my ads profitable" here is yes, and the answer to "is TikTok profitable" is that nobody knows yet. Its real number sits somewhere between 1.4 and 3.2, and break-even is 2.4. No dashboard settles that. A test does: cut TikTok spend in half for two weeks, watch total Shopify revenue, and see whether it moves by more than the spend you saved. I'd run that test before touching Meta's budget, because Meta is the one the store can already prove.
The dashboards will keep disagreeing. Your Shopify total is the only number neither of them gets to edit.
FAQ
How do I know if my Facebook ads are actually profitable? Take the revenue from your store, not from Ads Manager, and subtract cost of goods, shipping, payment fees and refunds to get contribution margin. Break-even ROAS is 1 divided by that margin as a share of revenue. If total revenue divided by total ad spend (MER) sits above break-even, the ads are paying for themselves overall. Platform ROAS alone can't tell you, because it counts revenue before costs and can include sales the ad didn't cause.
What is the difference between ROAS and blended ROAS (MER)? ROAS is the revenue an ad platform attributes to its own ads, divided by spend on that platform. Blended ROAS, often called MER (marketing efficiency ratio), is your store's total revenue divided by total ad spend across every platform. MER can't be inflated by attribution, so it's the better check on whether ads work as a whole, though it can't tell you which platform did the work.
Why do Meta and TikTok report more sales than Shopify? Each platform credits itself for any sale inside its attribution window, which can include sales days after a click and sales from people who only saw an ad. Neither platform knows about the other, so one customer who saw a TikTok video and later clicked a Meta ad can be counted as a conversion by both. Add the two dashboards together and the total often exceeds what your store actually sold.
Can Claude analyze my Meta and TikTok ads data? Yes. Export campaign reports from Meta Ads Manager and TikTok Ads Manager plus your Shopify orders as CSV, upload them to a Claude chat, and ask for spend, platform-reported revenue, actual orders and contribution margin by week. Claude caps how many files a chat can hold and how large each one can be, so check Anthropic's current upload limits before a big export. You redo the exports every time you want a fresh answer.
What is a good break-even ROAS for ecommerce? It depends entirely on your margin. Break-even ROAS is 1 divided by your contribution margin before ads. A store keeping 40% of revenue after cost of goods, shipping, fees and returns breaks even at a ROAS of 2.5. A store keeping 25% needs 4.0. Work out your own before judging any campaign.
Find out if Contextflo is the right fit for you.
See how teams use Contextflo

Related posts


Keep reading

Conversational analytics: 5 ways to set it up, compared
7 min read
How to connect Claude to BigQuery (and fix the errors you'll hit)
8 min read

How to connect Claude to Postgres (and keep it read-only)
7 min read

How to build a BI dashboard with Claude that your team can actually trust
8 min read

How to give Claude read-only access to your database (it isn't always the default)
7 min read

You connected your warehouse to Claude, now what?
5 min read
Why we built our own Postgres MCP server
7 min read

Which closed deals churned within a year? How to connect HubSpot and Stripe with AI
8 min read
Is your retention improving? How to run a cohort analysis with AI, no SQL
8 min read