Why are customers opening tickets? How to find the patterns in Zendesk or Intercom with AI
Hi, this is Vivek, building Contextflo. I share practical notes on getting answers from your data, a couple of times a month.
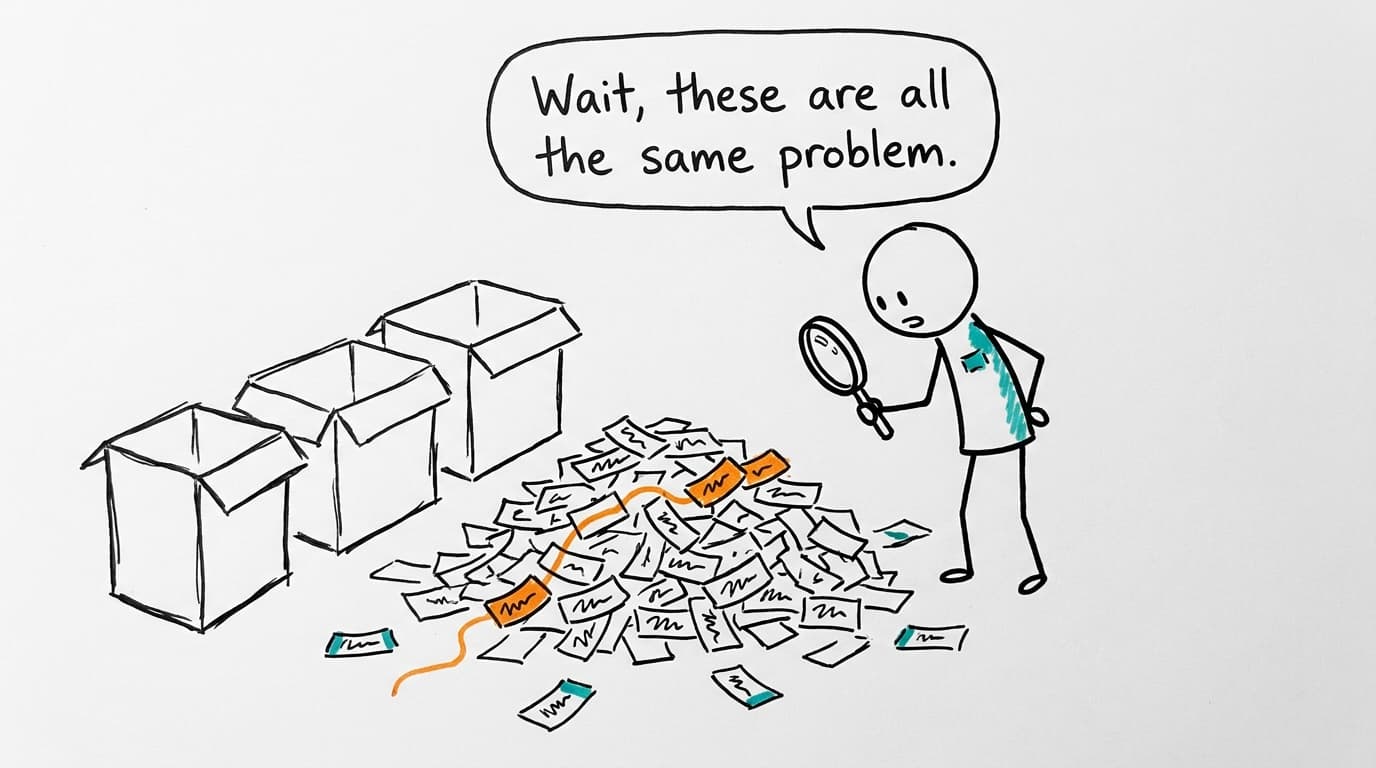
Customers open tickets for a small number of reasons, and those reasons are usually not the ones your tag report shows. To find them, skip the tags and read the ticket text: have AI sort a few hundred recent tickets into themes, count and trend each theme, and divide by active customers so growth doesn't hide a real increase. Then rank themes by what they cost you in repeat contacts, resolution time and unhappy customers. The biggest tag is often a pile of easy questions, while the theme doing the damage is scattered across three tags nobody thought to combine.
Your tags describe your team, not your customers
Tags look like data, which is why they get trusted. But every tag was picked by an agent in the few seconds before closing a ticket, from a list someone wrote when the product looked different.
A few habits wreck them. Different agents tag the same problem differently, so one bug shows up as "technical issue" from one person and "integration" from another. Anything the list didn't anticipate goes into "other", and "other" quietly becomes the biggest category. And a ticket that says "I can't export, also why was I charged twice, and how do I add a user" gets one tag, usually the first issue or the easiest.
None of this is anyone's fault. Tags were built to route tickets, and they do that fine. Reporting on them asks them to do a second job they were never checked for.
Let the ticket text pick the themes
The customer's own words are the most honest record you have. AI is good at reading a few hundred of them and grouping what's alike, which is exactly the part that used to take a support lead a whole afternoon with a spreadsheet.
- Pull the last few hundred tickets with the first customer message, the tags, the created and solved dates, the requester's email and organization, and the satisfaction rating if there is one.
- Ask for themes written as plain sentences ("export to CSV fails on large files"), never single words like "export". A theme should be specific enough that someone could fix it.
- Allow more than one theme per ticket. The three-issue ticket should count three times.
- Read ten tickets from each theme yourself. If a theme mixes two problems, split it and rerun.
- Save the final list of themes with a one-line definition each, and reuse it next month. If the definitions change every run, the trend line means nothing.
Step five is the one teams skip, and it's why the first analysis is useful and the third one argues with the first.
Count per customer, not per ticket
Ticket volume goes up when the business grows, and that part is just more customers. The number to watch is contact rate: tickets, or customers who opened at least one, divided by active customers in the same period.
A month where volume rose 20% and active customers rose 25% was a good month for support, even if the queue felt worse. A month where volume stayed flat while the customer count dropped deserves a closer look. Contact rate also makes plans comparable. Enterprise accounts may send more tickets each, but if a cheaper plan has a higher contact rate per account, that's where the product is confusing people.
Which themes are costing you?
Volume ranks themes by how often they happen. Cost ranks them by what they do to customers and your team. Put these next to every theme:
| Measure | What it tells you |
|---|---|
| Repeat contacts | Same customer writing in again on the same theme within a couple of weeks, meaning the first answer didn't fix it |
| Reopen rate | Tickets marked solved that came back |
| Median time to resolve | Themes that need an engineer or a workaround, not a help article |
| Satisfaction rating | Where customers are leaving unhappy, whatever the volume |
| Customers affected | One loud account versus fifty quiet ones |
A theme with a hundred tickets, a two-hour resolution and happy customers is a docs job. A theme with forty tickets, a two-day resolution and a third of customers writing back is a product problem, and it's usually the one that shows up later in the list of customers about to churn.
Tie every theme to someone who can fix it
A theme list only changes anything when each theme lands with an owner. Three joins make that easy.
Product areas. Map each theme to the part of the product it's about, so the engineering lead for billing sees billing themes and nobody else's.
Releases. Put release dates on the weekly theme trend. A theme that jumps the week after a release, and mostly from customers of the feature that changed, is a regression whether or not anyone filed a bug.
Customer segments. Split themes by plan, company size or account age. Onboarding themes concentrated in accounts younger than 30 days point at the setup flow. The same themes from year-old accounts point at something that changed on them.
What you hand over should be short. Product gets the top three themes by cost, with ticket counts, affected customers, a few example tickets and the release they started after. The docs team gets the high-volume, fast-resolving themes, because each one is a help article or a tooltip that would have prevented the ticket.
If the question is narrower, one ticket and what went wrong for that customer, how a support rep traced a missing refund without the data team covers that side.
Connecting Zendesk or Intercom
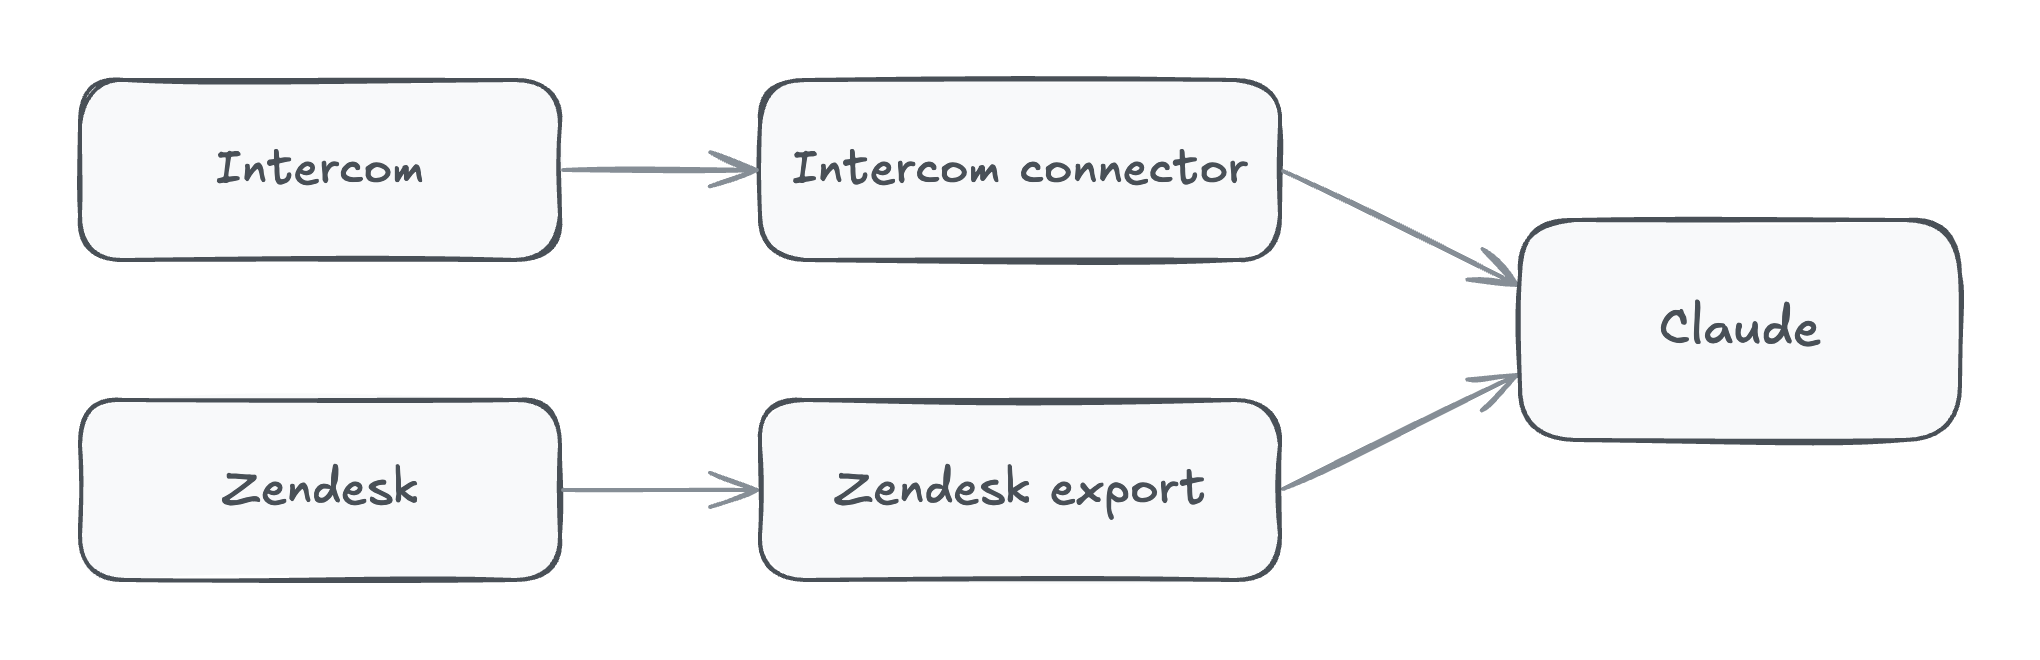
Intercom makes a connector for Claude, listed as Anthropic verified in Claude's connector directory, with tools to search and fetch conversations and contacts.[1] Intercom's own MCP server documentation adds companies and Help Center articles, supports US and EU hosted workspaces, and has setup guides for Claude.ai, Claude Desktop and Claude Code.[2] For "what were people asking about this week" it's the quickest route, and it reads live data.
For Zendesk, or for a large historical batch from either tool, export the tickets. Zendesk admins can export account data as JSON, CSV or XML once exports are enabled for the account, and plan matters, so check what yours includes. Pick JSON if you want the ticket text: Zendesk's CSV export leaves out ticket comments and descriptions.[3] Intercom has its own conversation export in its help center.[4] Either way, include text, tags, created and solved dates, requester and organization, and satisfaction ratings, then upload to a Claude chat and check Anthropic's current file limits if it's big.[5]
With Contextflo
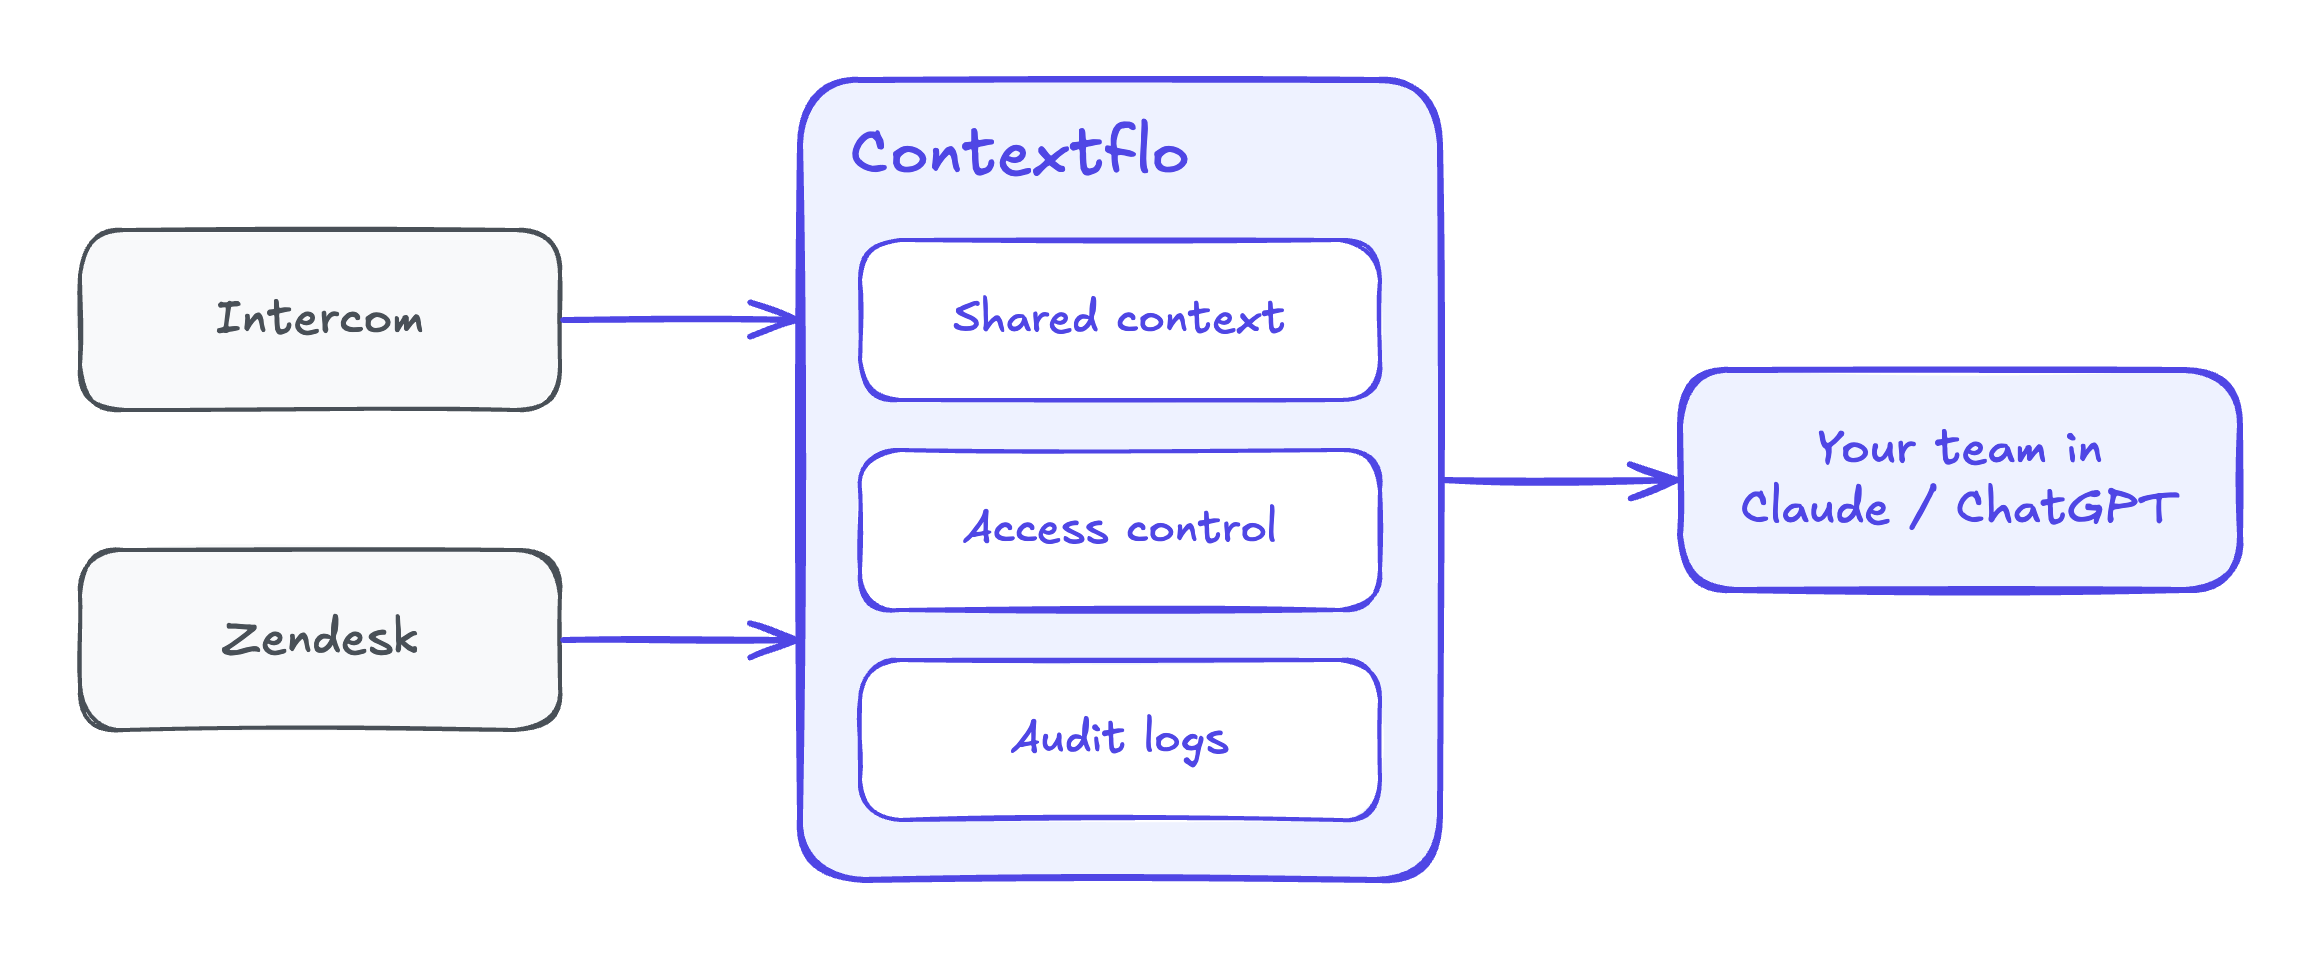
Connect Zendesk or Intercom to Contextflo and the whole support team can ask about tickets in Claude. The theme list and its definitions are saved as shared context, so "integration sync failed" means the same thing in March as in September, and the month-over-month trend holds up. Tickets sit next to your product usage and billing data, so contact rate by plan or the ticket history of accounts that later cancelled is one question away. Product and CX leads can ask the same questions and get the same numbers.
Get in touch and we'll set up the Zendesk or Intercom connection with you. Book 20 minutes.
Five prompts, run in order
- Theme the last batch.
Here are our last 500 support tickets. Read the first customer message
of each and group them into 10-15 themes, each written as a specific
sentence someone could act on. A ticket can belong to more than one
theme. For each theme give the ticket count, the number of distinct
customers, and three example ticket IDs. Then show how each theme maps
to our existing tags.
- Trend it.
Using the theme definitions above, count tickets per theme per week for
the last 12 weeks. Flag any theme whose weekly count doubled compared
with its own 8-week average.
- Divide by customers.
Calculate contact rate by plan for last month: customers who opened at
least one ticket divided by active customers on that plan, and tickets
per active customer. Show the counts next to every rate.
- Check a release.
We shipped a release on September 9. Compare theme counts for the two
weeks before and the two weeks after. Which themes grew, and are the
new tickets concentrated among customers of the feature that changed?
- Bring in product and plan data.
Match ticket requesters to our product usage and billing data by email
and account. For the three themes with the lowest satisfaction, show
the plan, account age and seats of the customers raising them, whether
they use the related feature weekly, and how many have downgraded or
cancelled since.
I'd check the theme mapping in prompt one against real tickets before running the rest. Everything after it inherits whatever it got wrong.
Worked example: billing was the biggest tag
The numbers here are illustrative. A B2B software company with about 1,200 active customers looks at its last 500 tickets. The tag report says billing is the problem, with 150 tickets, 30% of the month.
The themed version:
| Theme | Tickets | Where agents tagged it | Repeat contacts | Median time to resolve | Satisfaction |
|---|---|---|---|---|---|
| Finding invoices and receipts | 95 | Billing | 4% | 2 hours | 92% |
| How to build a report | 90 | How-to, Other | 6% | 3 hours | 90% |
| Integration sync stopped | 72 | Technical issue, Other, Billing | 31% | 26 hours | 61% |
| Login and SSO | 60 | Account | 8% | 3 hours | 88% |
| CSV import errors | 55 | Technical issue | 12% | 9 hours | 79% |
| Plan changes and refunds | 48 | Billing | 10% | 5 hours | 84% |
| Everything else | 80 | Mixed |
Most of the billing tag turned out to be people who couldn't find an invoice. That's 95 fast, friendly tickets, and one help article plus a link in the receipt email makes most of them go away.
The theme that mattered didn't have a tag. Integration sync failures were split across three tags, so none of them looked unusual. Put together, they had the worst repeat rate, the slowest resolution and the lowest satisfaction on the list. The weekly trend showed three or four a week until the release on September 9, and about twenty a week after it. 58 accounts raised it, out of 310 that use the integration, and most were on the mid-tier plan that got the new sync schedule in that release.
Contact rate made the case in one line. Overall, 0.42 tickets per active customer that month. Among accounts using the integration, 0.7.
Product got the sync theme with the release date, the 58 accounts, and ten example tickets. The docs team got invoices and report-building. The support lead saved the theme definitions so next month's run counts the same things, and the "other" tag has been shrinking since.
FAQ
How do I find out why customers are contacting support? Read the ticket text instead of the tags. Take a recent batch of tickets, have AI group the first customer message into themes described in plain language, then count each theme, trend it by week, and compare it with your number of active customers. The themes that grow faster than your customer base, or that come with repeat contacts and low satisfaction, are the ones worth fixing first.
Why are Zendesk and Intercom ticket tags unreliable for reporting? Tags are chosen by whoever handled the ticket, under time pressure, from a list that was written a while ago. Different agents pick different tags for the same problem, anything new lands in a catch-all like 'other', and a ticket that raises three issues usually gets one tag. The result describes how your team tags, which drifts, more than what customers are asking about.
What is a good way to measure support ticket volume? Divide tickets, or customers who opened at least one ticket, by active customers in the same period. That contact rate stays comparable as you grow. Raw volume rises with every new customer, so a flat contact rate with rising volume is healthy, and a rising contact rate means something in the product or docs is generating questions.
Can Claude analyze Zendesk or Intercom tickets? Yes. Intercom makes its own connector for Claude that can search conversations, tickets and contacts. For Zendesk, or for a large historical batch from either tool, export tickets with their text, tags, dates, requester and organization, and satisfaction ratings, then upload the file to Claude and ask it to theme and count them.
How do I connect support tickets to product releases? Put release dates next to your weekly theme counts and look for themes that jump in the week or two after a release, then check whether the affected customers use the feature that changed. If you can join ticket requesters to product usage data by email or account, you can see exactly which customers of that feature are writing in.
Find out if Contextflo is the right fit for you.
See how teams use Contextflo

Related posts
Keep reading
Conversational analytics: 5 ways to set it up, compared
7 min read
How to connect Claude to BigQuery (and fix the errors you'll hit)
8 min read
How to connect Claude to Postgres (and keep it read-only)
7 min read

How to build a BI dashboard with Claude that your team can actually trust
8 min read
How to give Claude read-only access to your database (it isn't always the default)
7 min read
You connected your warehouse to Claude, now what?
5 min read
Why we built our own Postgres MCP server
7 min read

What should go in the board deck this month? How to pull metrics from HubSpot and Stripe with AI
7 min read

Which closed deals churned within a year? How to connect HubSpot and Stripe with AI
8 min read