How to automate recurring data reports with AI
Hi, this is Vivek, building Contextflo. I share practical notes on getting answers from your data, a couple of times a month.
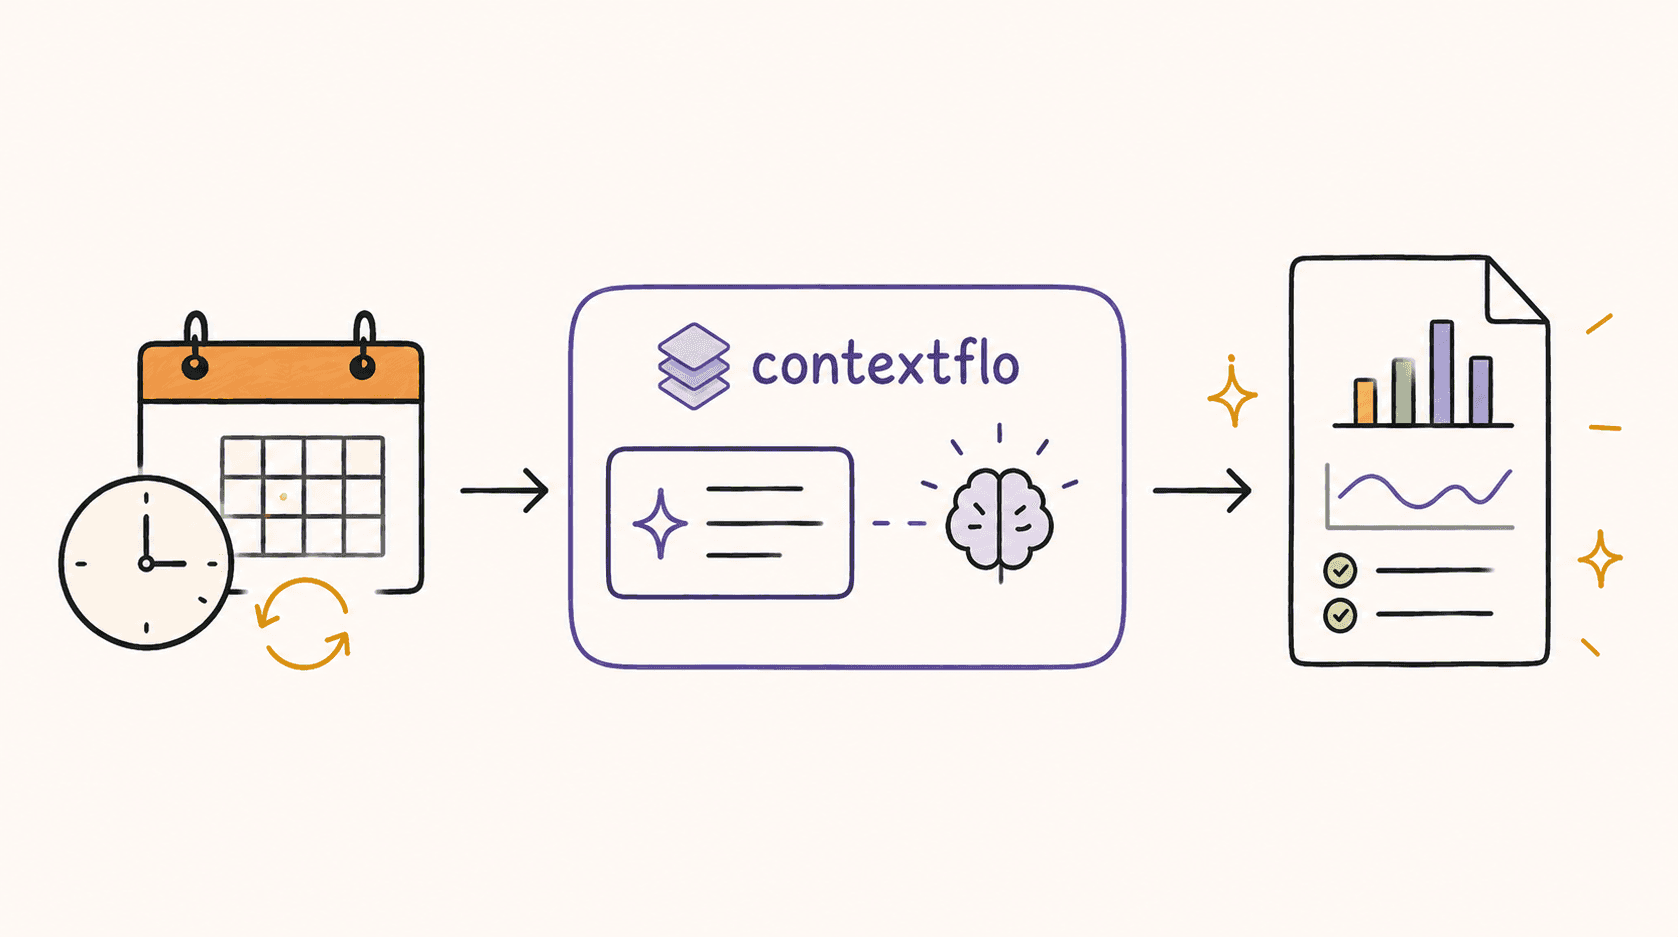
Some questions are worth asking once. Others you ask every Monday: how did churn look this month, what were the top campaigns, is anything odd in usage.
Those second ones are the tax. Somebody re-runs the same queries, re-reads the same numbers, and re-writes the same summary, and the only thing that changed is the date range.
Contextflo reports are that loop, scheduled. You describe what you want to know, pick a cadence, and an agent queries your data on schedule, writes up what it found with charts, and delivers it to email or Slack.
A report is a prompt with a schedule
That is the whole model. You describe the question in plain English, and on your cadence the agent queries your connected sources, analyses the results, and writes a structured report with narrative and visualisations.
The important part is that it is a prompt and not a saved query. A saved query returns the same rows in a different shape each week. A prompt can notice that the number moved and go looking for why, which is the part a human would otherwise have to do.
Creating one
Ask for it in your LLM. Something like: "Create a weekly report on churn by plan tier with week-over-week comparison." The agent sets it up and asks you to pick a schedule: daily, weekly or monthly, at a time you choose, in your timezone.
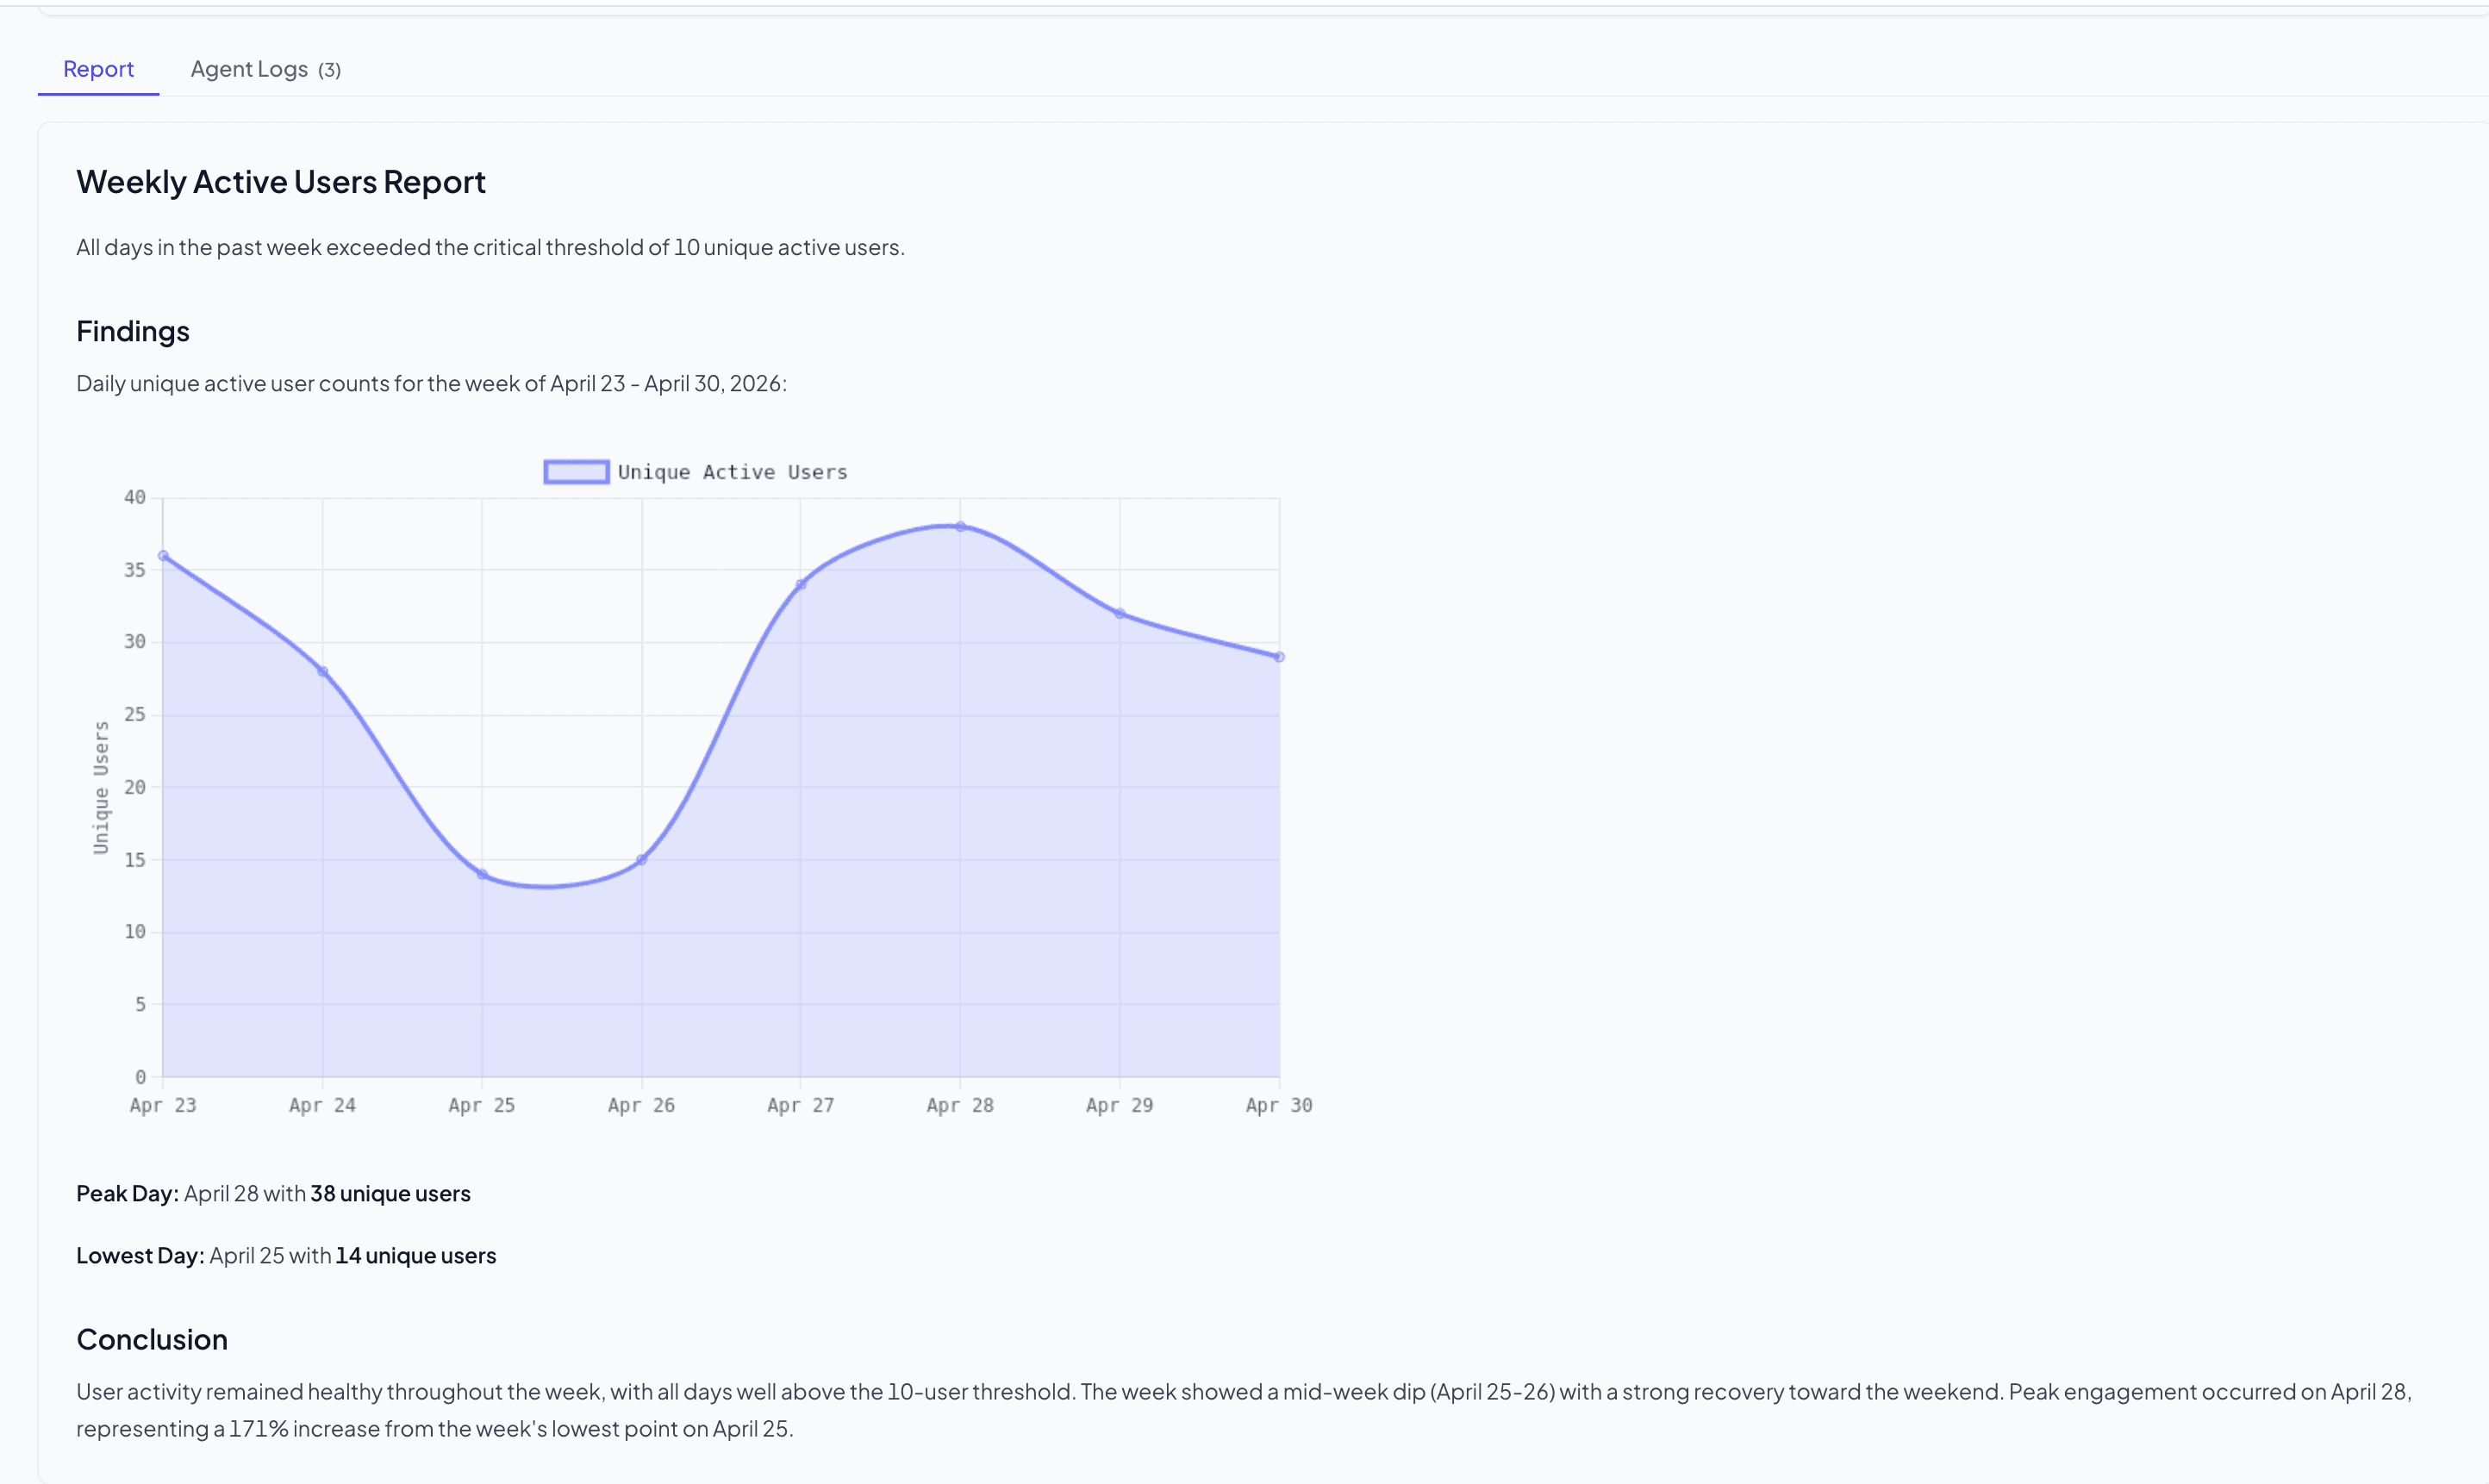
At the scheduled time, the run looks like this:
Writing a prompt that produces something worth reading
This is where reports succeed or fail, and it is worth more attention than the scheduling.
Say what decision it feeds. "Weekly churn report" produces a number. "Weekly churn by plan tier, flagging any tier that moved more than two points, because we're deciding where to focus retention" produces something you can act on. The agent writes to the brief it is given.
Name the comparison. Almost every useful report is a comparison: against last week, against the same week last year, against target. A report without one is a number with no opinion about whether it is good.
Ask it to flag, not just list. "Call out anything unusual and say why you think it moved" turns a summary into an analysis. It will sometimes be wrong, which is what the execution logs below are for.
Lean on what you have already defined. The agent uses your saved queries, metrics and business concepts as context. If active user is defined once in Contextflo, every report means the same thing by it. If it is not, each report is the model's best guess, and two reports can disagree.
That last one compounds: the more definitions you have built up, the less each new report needs spelling out.
Editing and iterating
First drafts are rarely right. Go to the web app to edit the prompt, adjust the schedule, or change delivery. Narrow the scope, add a specific question, point it at different sources. The next run picks up the change.
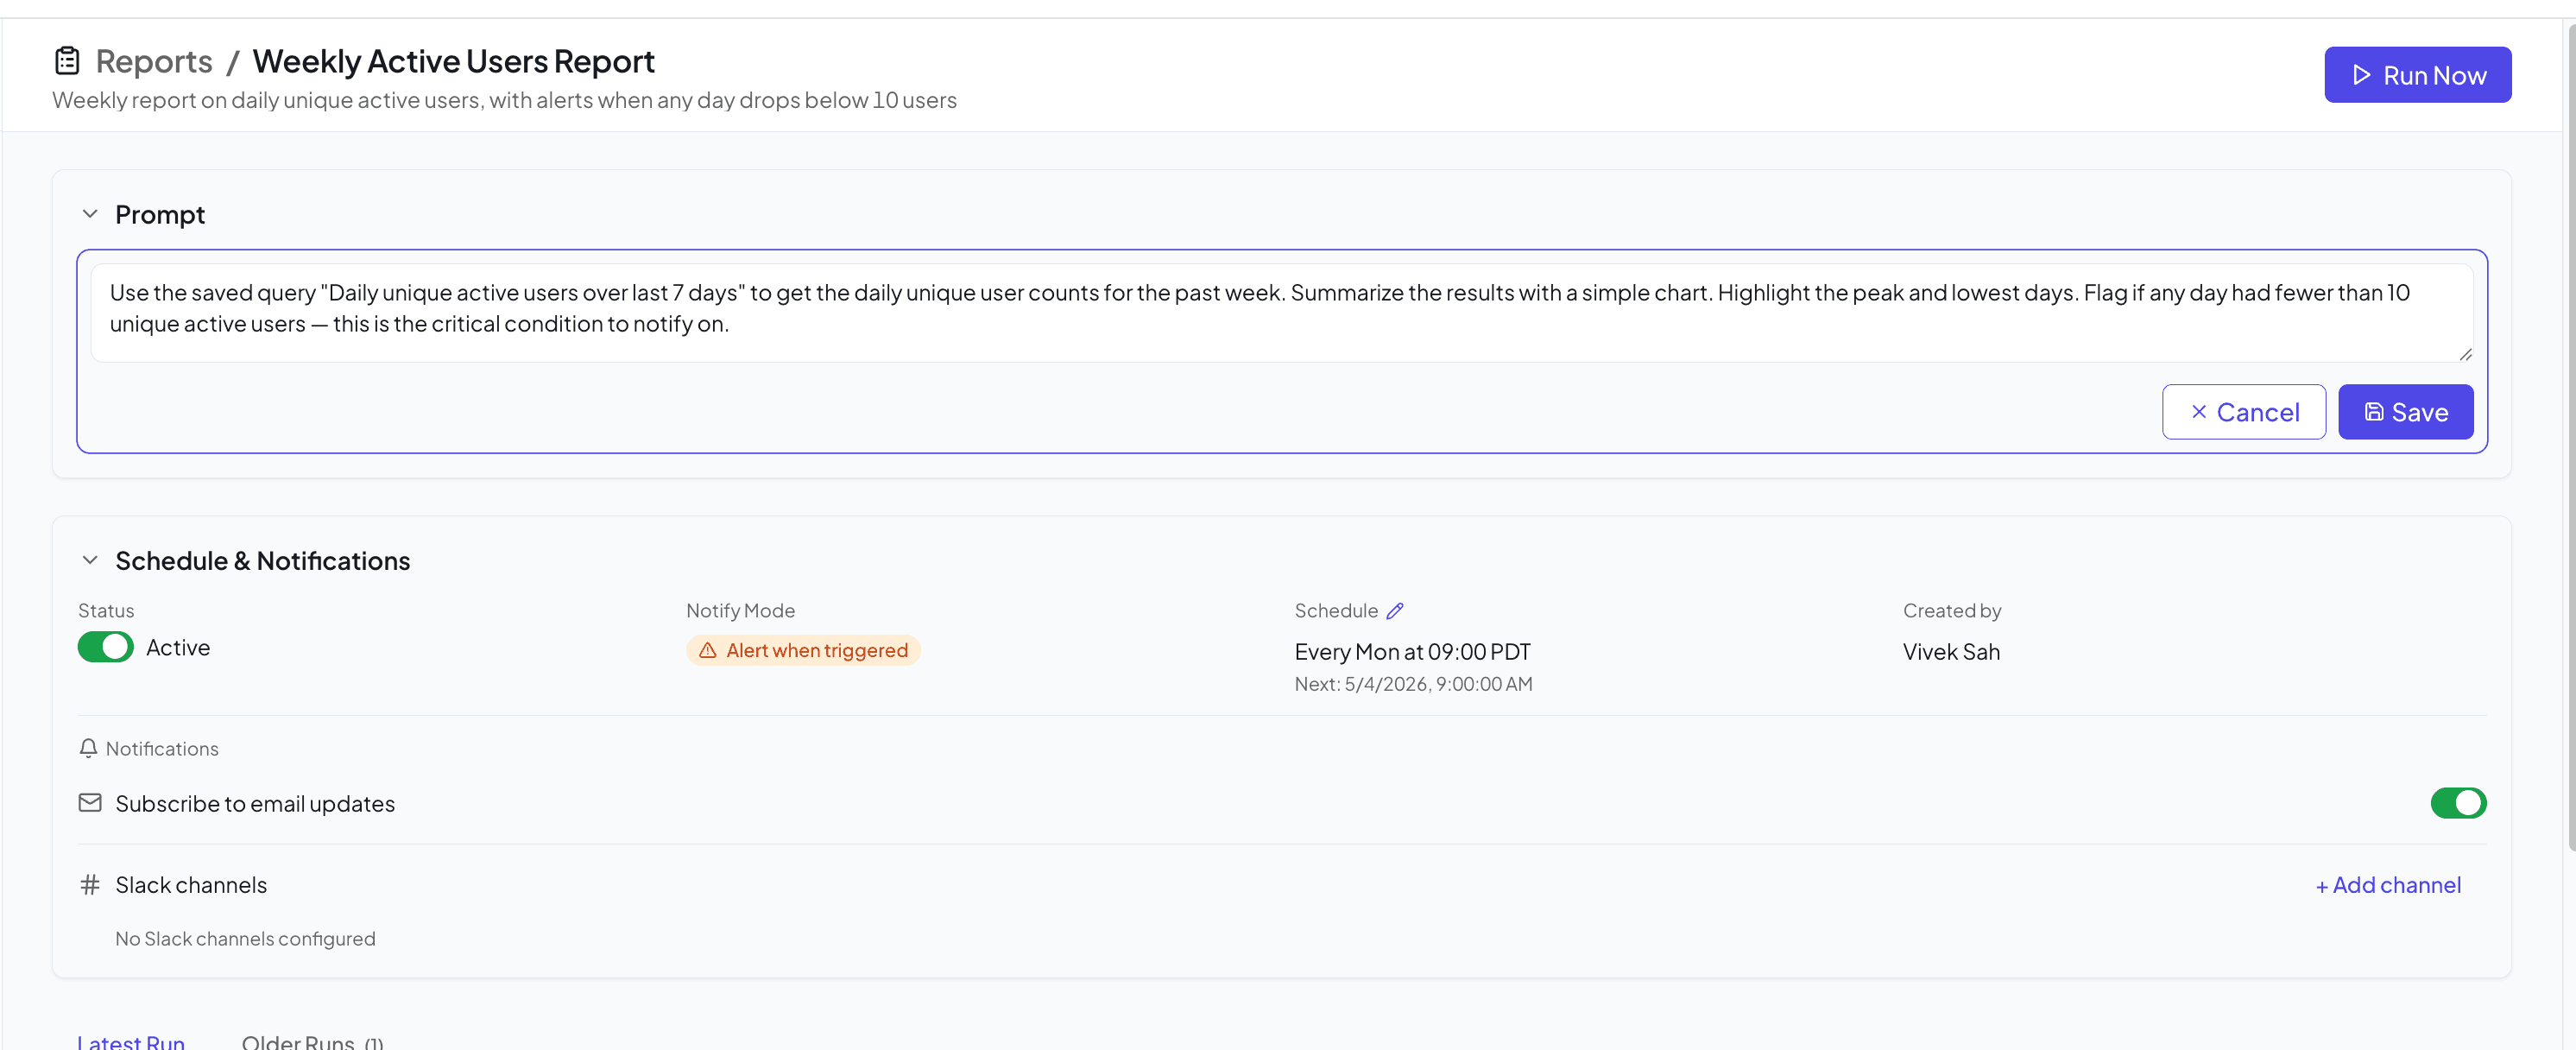
You can pause a report or archive it when it is no longer needed, and it is worth actually doing that. A scheduled report nobody opens is worse than no report, because it looks like coverage.
Delivery: email and Slack
Email sends the full report body with rendered charts inline. No attachment to download.
Slack posts to a channel you pick, with tables formatted as native Slack blocks so they read properly in-thread. You can also push any past run to a channel by hand.
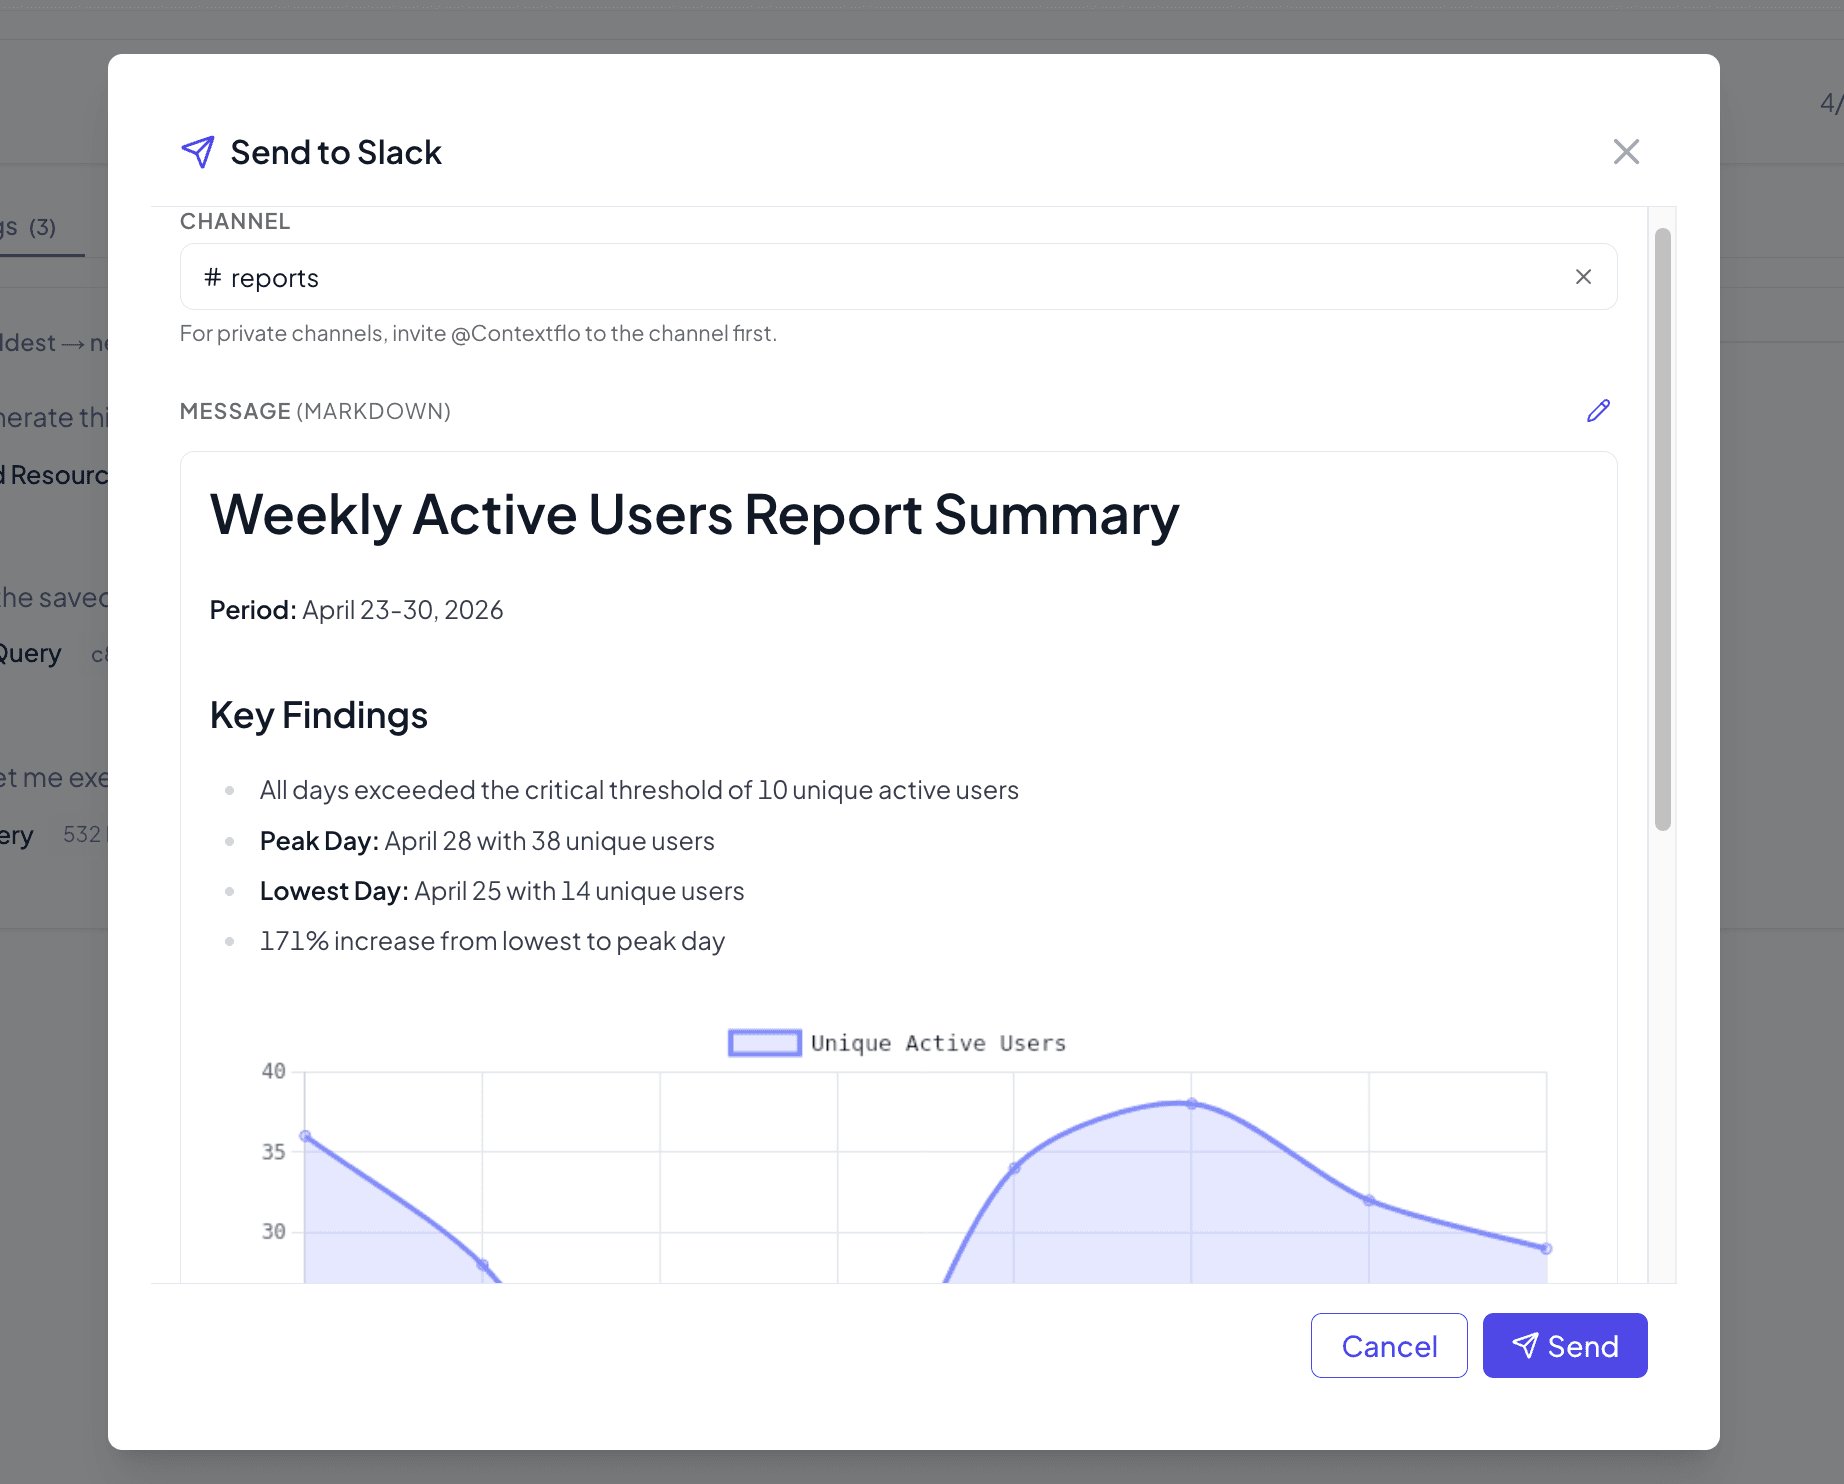
Slack tends to get read and email tends to get archived, so for anything a team should actually discuss, the channel is the better default.
You can check its work
Every run includes execution logs: which tools the agent called, what SQL it ran, and how it got to its conclusions. If a number looks wrong, you can trace it to the query that produced it.
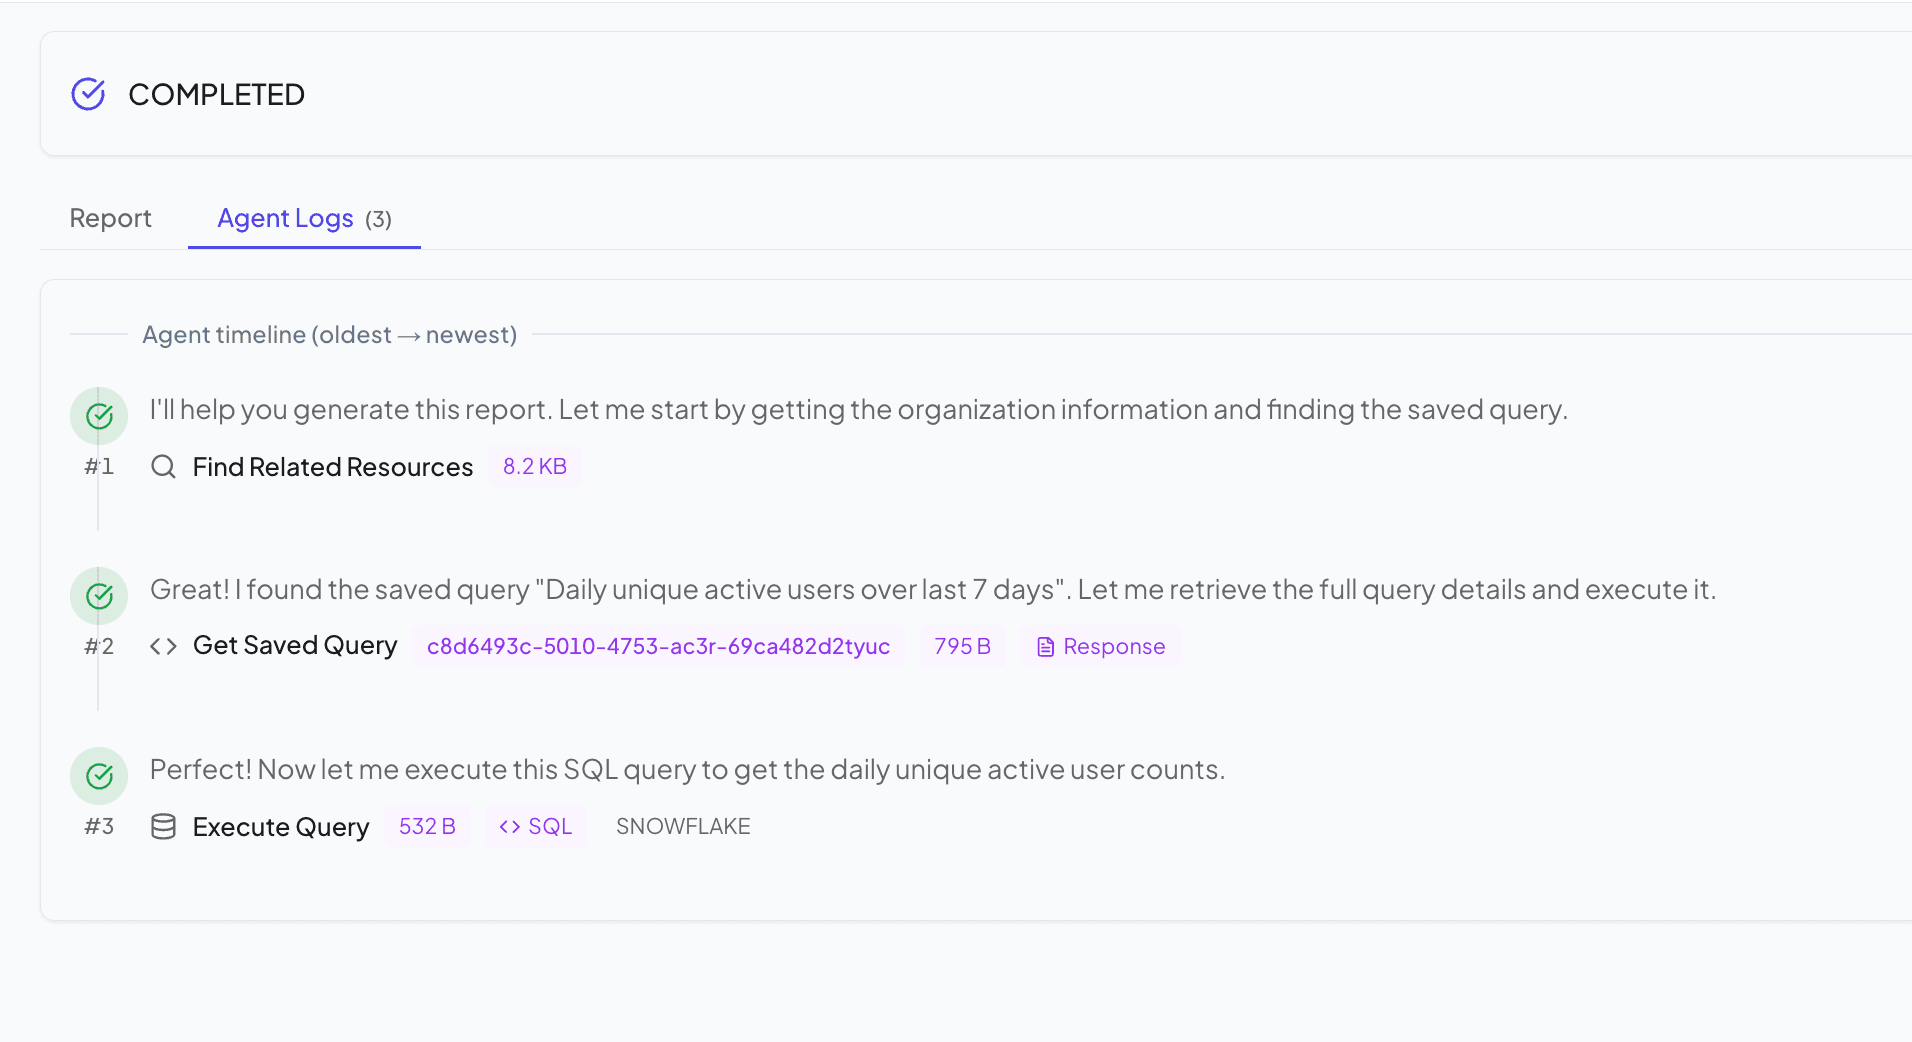
This matters more for scheduled reports than for anything else you do with an LLM. An ad-hoc answer gets scrutinised by the person who asked for it. A recurring report gets skimmed by people who were not there when it was set up and have no idea what assumptions went into it, so being able to open the run and read the actual SQL is the difference between a report you trust and one you merely receive.
Worth doing on the first two or three runs of any new report, then whenever a number surprises you.
Where this fits
Reports handle the recurring questions. Dashboards handle the ones you want to look at on demand. Chat handles everything else. Most teams end up with a handful of each, and the reports are usually the ones that save the most time, because they replace work somebody was doing by hand on a calendar reminder.
Start simple: "Create a weekly report summarising new signups and churn." Read the first run, see what is missing, refine.
Find out if Contextflo is the right fit for you.
See how teams use Contextflo

Related posts

Keep reading
Conversational analytics: 5 ways to set it up, compared
7 min read
How to connect Claude to BigQuery (and fix the errors you'll hit)
8 min read
How to connect Claude to Postgres (and keep it read-only)
7 min read

How to build a BI dashboard with Claude that your team can actually trust
8 min read
How to give Claude read-only access to your database (it isn't always the default)
7 min read
You connected your warehouse to Claude, now what?
5 min read
What is a semantic layer?
5 min read
How to connect Google Sheets to Claude, and ask it alongside your warehouse
4 min read
A travel company's revenue team stopped opening Power BI every morning
3 min read