Why did my sales drop this month? How to find out with Claude
Hi, this is Vivek, building Contextflo. I share practical notes on getting answers from your data, a couple of times a month.
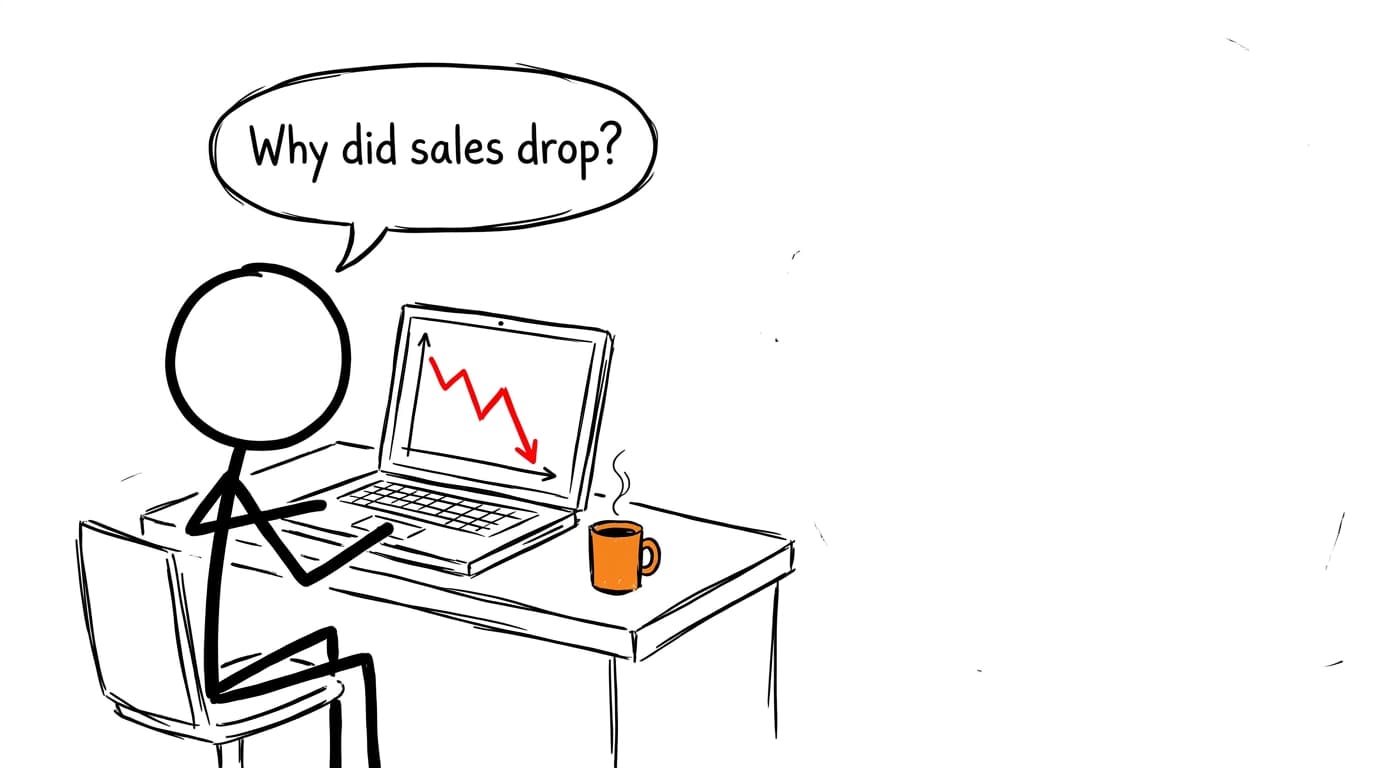
When sales drop, the cause is almost always in one of three numbers: how many people visited, what share of them bought, and how much each order was worth. Revenue is traffic times conversion rate times average order value. Work out which of the three moved, split that one by channel, device, product and new versus returning customers, and hold it against the same month last year so you don't chase a normal seasonal dip. That process finds the cause in most months, with or without AI. Claude just makes it an afternoon instead of a weekend.
Start with the formula
Every revenue drop has to pass through one of these levers, so checking them first saves you from guessing.
| Lever | If it fell, look at | Common causes |
|---|---|---|
| Traffic (sessions) | Channel mix | Ad budget cut or paused campaign, rising CPMs, email sent less often, a search ranking lost |
| Conversion rate | Landing pages, products, device | Best-seller out of stock, price increase, broken checkout or payment method, slow mobile page, ads sending the wrong people |
| Average order value | Product mix, discounts | Heavier discounting, free-shipping threshold changed, bundles removed, cheaper products selling more |
| Seasonality | Same months last year | Post-holiday slump, back-to-school, a promo last year you didn't repeat |
Two numbers can mislead you here. Shopify and GA4 will rarely agree on sessions or orders, so pick one source per number and stick with it for every period. And a "drop" in a short month, or a month with one fewer weekend, can be a calendar effect. Daily averages fix that.
Split the lever that moved
Once you know which lever fell, cut it four ways and look for the slice that carries most of the gap:
- By channel: paid social, paid search, email, organic, direct. A drop concentrated in one channel is usually about that channel.
- By device: mobile conversion falling while desktop holds steady is a site problem more often than a demand problem.
- By product: one SKU going out of stock can pull the whole store's conversion rate down, because the ads and emails keep sending people to it.
- By customer type: new versus returning. Returning customers steady and new ones down points at acquisition. Both down points at the offer, the site or the season.
If I could only run one cut, I'd run channel first, because it's the one most likely to point at something you changed yourself.
Then compare the same two months last year. If September was 6% below August last year too, you only need to explain the part beyond that.
The quick way: export your data and ask Claude
You probably already have everything you need. It's scattered across a few admin screens.
- Export your orders. In Shopify, Orders, then Export, as CSV, covering this month, last month and the same two months last year.
- Export your traffic. Shopify's sessions report, or a GA4 report with sessions by default channel group and device, downloaded as CSV for the same periods.
- Optionally, export ad spend from Meta Ads Manager and Google Ads by campaign and day.
- Upload the files to a Claude chat, or put them in a Google Sheet and link it through Claude's Google Drive connector, which can read Sheets.[1][2]
Then ask. These prompts work better than "why did sales drop?" because they force the decomposition:
Using the orders and sessions files, calculate revenue, sessions, orders,
conversion rate and average order value for September and August of this
year and last year. Show which of the three levers explains most of the
change from August to September, and how that compares to last year.
Take the lever that moved most and split it by channel, device and
new vs returning customer. Which slice accounts for most of the drop?
Show the numbers, not just the conclusion.
List the top 10 products by revenue in August and September. For each,
show units, revenue and the days it sold zero units. Flag any product
that stopped selling for 3+ days in a row.
A good answer gives you a small table per period, names the lever and the slice, and shows the arithmetic so you can check it. If Claude jumps straight to "it's probably seasonal" without last year's numbers on the page, ask it to show them.
Where it runs out
Claude caps how many files a chat can hold and how large each one can be, and Projects use their own separate cap, so check Anthropic's current upload limits before you plan around it[1], though size is rarely the problem for a small store. The friction is elsewhere. The files are a snapshot, so next month you export everything again. Claude recalculates "conversion rate" from scratch each time, and it may count cancelled orders or test orders differently from how you did last month. Nobody else on the team sees the analysis unless you send it to them.
Connect it once with Contextflo
Upload your Shopify export and connect the Google Sheet where you track traffic or ad spend to Contextflo, and Claude or ChatGPT can read both directly from then on, plus your warehouse too if you have one. The Sheet re-imports on its own when it changes, so you're not re-uploading a fresh CSV every month.
The part worth setting up is telling the agent how your team counts things, for instance that conversion rate excludes cancelled and test orders. Save that once and every month's answer uses the same definition instead of a fresh guess.
Save the ad spend and cost sheets next to it too, and anyone on the team asking about this month's drop gets the same numbers, built the same way, instead of a chat that forgets by next week.
Asking every month? Put it in a warehouse
If this becomes a monthly ritual, move the data somewhere it updates on its own. Fivetran and Airbyte (which has a free, open-source version) both have Shopify, Meta Ads and Google Ads connectors that load into BigQuery, Snowflake or Postgres on a schedule. GA4 has a built-in BigQuery export, though it doesn't backfill history from before you turn it on. The steps are in how to connect Google Analytics to Claude.
Then point Claude at the warehouse, directly (Claude with BigQuery) or through Contextflo so the definitions are shared. A plan or target sheet that never makes it into the warehouse can still sit next to it, as in connecting Google Sheets to Claude.
An example: an 18% drop, one question at a time
The numbers below are made up for illustration. Picture a small apparel store: August revenue $84,000, September $68,880, down 18%.
| Question | Answer | What it rules in or out |
|---|---|---|
| Which lever moved? | Sessions 42,000 to 40,000 (−5%). Conversion 2.0% to 1.75% (−12.5%). AOV $100 to $98.40 (−2%). | Conversion is most of it. Traffic and order value are minor. |
| Is this seasonal? | Last year, September was 6% below August. | About a third of the drop is normal. The rest needs a cause. |
| Which channel's conversion fell? | Paid social went from 1.8% to 1.1%. Email, search and direct held within 0.1 points. | Rules out a sitewide checkout or pricing problem. |
| Mobile or desktop? | Both fell by a similar amount on paid social. | Rules out a mobile page speed issue. |
| Which products lost sales? | The best-selling jacket sold zero units from Sept 8 to 16. | Rules in a stock-out. |
| Where were the ads pointing? | Two of the three prospecting ads landed on that jacket's product page. | Found it: ads kept paying to send new visitors to a sold-out page. |
Six questions, and the answer is a stock-out that nobody connected to ad performance, which is the kind of thing that hides when the ads dashboard and the inventory report live in different tabs. The fix is operational: pause or redirect ads when a hero product goes out of stock, and set a low-stock alert.
The first time you run this, it'll feel slow. The second month, you already know which six questions to ask, and the only real work left is keeping the data current.
FAQ
Why did my sales suddenly drop? Revenue is traffic times conversion rate times average order value, so a drop always shows up in one of those three first. Fewer visitors usually points at ads, email or search. A lower conversion rate points at the site: stock-outs, price changes, a broken checkout, a slow page. A lower order value points at discounts or product mix. Compare each one to last month and to the same month last year to see which moved.
How do I find out why my Shopify sales dropped? Export your Shopify orders and your traffic numbers (Shopify's sessions report or GA4) for this month, last month and the same month last year. Work out sessions, conversion rate and average order value for each period, then split the one that moved by channel, device, product and new versus returning customers until one slice explains most of the gap.
Can Claude analyze my Shopify sales data? Yes. Upload your Shopify orders CSV and a traffic export to a Claude chat, or link a Google Sheet through Claude's Google Drive connector, and ask it to break revenue into traffic, conversion and order value. Claude caps how many files a chat can hold and how large each one can be, so check Anthropic's current upload limits before a big export. The catch is that it's a one-off snapshot you redo every month.
How do I know if a sales drop is just seasonal? Compare the same two months from last year. If sales fell by a similar percentage between August and September last year, most of this year's drop is the calendar. Only the part beyond last year's dip needs an explanation.
Find out if Contextflo is the right fit for you.
See how teams use Contextflo

Related posts

Keep reading
Conversational analytics: 5 ways to set it up, compared
7 min read
How to connect Claude to BigQuery (and fix the errors you'll hit)
8 min read

How to connect Claude to Postgres (and keep it read-only)
7 min read
How to build a BI dashboard with Claude that your team can actually trust
8 min read

How to give Claude read-only access to your database (it isn't always the default)
7 min read

You connected your warehouse to Claude, now what?
5 min read
Why we built our own Postgres MCP server
7 min read

What should go in the board deck this month? How to pull metrics from HubSpot and Stripe with AI
7 min read

Which closed deals churned within a year? How to connect HubSpot and Stripe with AI
8 min read