Who are your best reps, really? How to compare them from your CRM with AI
Hi, this is Vivek, building Contextflo. I share practical notes on getting answers from your data, a couple of times a month.
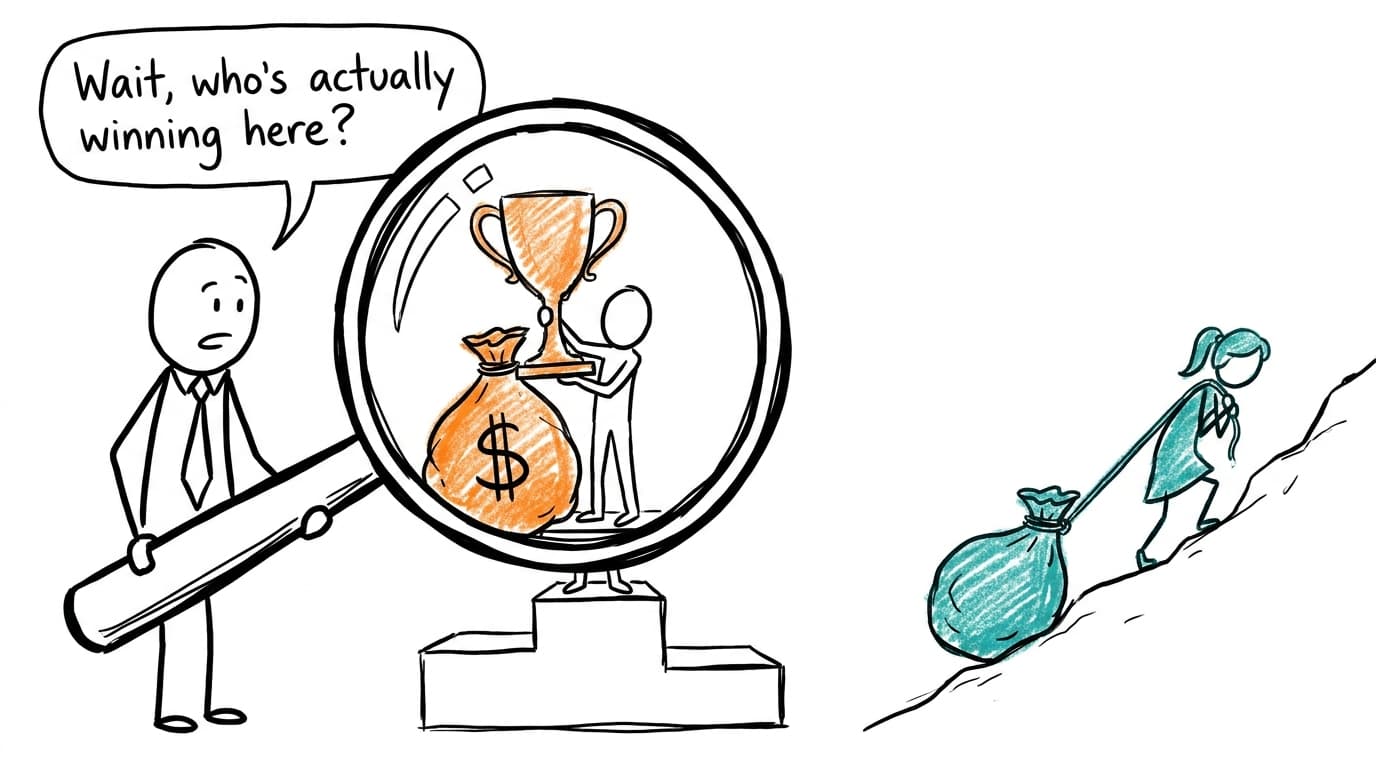
Your best rep is usually not the one at the top of the quota leaderboard, or at least you can't tell from that leaderboard. Attainment mixes selling skill with territory, lead quality, inherited pipeline and luck. To see who is actually strong, put win rate, deal size, cycle length and self-sourced pipeline side by side, then compare each rep against the team's results for the same segment and lead source. The rep who beats their own baseline by the widest margin is the one to learn from, and the stage where someone falls furthest below it is where coaching will pay.
Why the quota leaderboard misleads
Attainment is the number the business runs on, and it should stay on the wall. It just answers "who brought in the most against their target", which is a different question from "who sells best". A few things routinely push a rep up or down that list without any change in how they sell:
- Territory. An enterprise patch with a few big logos and a mid-market patch full of fast deals get the same quota more often than anyone admits.
- Lead quality. A rep who gets the inbound demo requests is closing warm buyers. A rep working outbound is starting from a cold email.
- Inherited pipeline. When someone leaves, their open deals go to whoever has room. The next two quarters of wins land on the new owner's record.
- Deal size mix. Two reps can win the same share of deals and end up far apart on attainment because one sells the bigger package.
- One whale. A single large deal can carry a whole year. Take it out and the ranking often reshuffles.
None of this means the top rep is weak. It means you can't tell yet.
The numbers that tell the story together
No single metric settles it. Read these as a set, each one per deal owner, over the same window:
- Win rate. Won deals divided by won plus lost, leaving open deals out. Also calculate it from each stage entered: of the deals a rep moved into evaluation, what share were won? That version shows where a rep's deals are lost.
- Average deal size. Median is often better, since one large deal drags the average.
- Sales cycle length. Median days from created to closed won.
- Pipeline created versus pipeline worked. How much of what the rep closed they sourced or opened themselves, and how much they inherited or were handed.
- Activity to outcome. Calls, meetings or emails per deal won. A rep who needs twice the meetings to win the same deal is either working harder deals or losing time somewhere.
- Discount rate. The average discount off list on won deals. A high win rate bought with deep discounts isn't the same skill.
- Forecast accuracy. How close each rep's committed deals came to what actually closed. A rep whose commit is reliable makes the whole forecast easier to trust.
Both HubSpot and Salesforce record an owner on every deal or opportunity, so all of these can be grouped by rep. Check one thing first: the owner field shows who owns the deal now. If deals were reassigned when someone left, decide whether credit goes to the original owner or the closer, and apply it to everyone.
Compare like with like
The fair comparison puts each rep against what the team usually gets from the same kind of deal.
Pick the two or three things that change win rates most for your business. Segment and lead source are the usual pair, and sometimes new business versus expansion. Calculate the team's win rate, deal size and cycle for each combination, over a longer window than the one you're judging. Then score each rep against the baseline for their own mix. A rep winning 37% of outbound mid-market deals, where the team usually wins 26%, is doing something worth copying, even if their attainment sits below someone who closed inbound demo requests at an average rate.
Small samples need the most care. A win rate built on a dozen decided deals can move 20 points on two outcomes. Put the deal count next to every rate, look across several quarters, and treat a new rep with a thin record as too early to call.
Coach from the stage, not the rank
Ranking reps tends to start an argument about fairness. Stage-level conversion ends it, because it points at something a rep can change.
For each rep, take the deals they moved into each stage and see what share went on to the next one. Compare that to the team's rate for the same stage and segment. Most reps track the team through most stages and fall off at one. A rep who converts discovery well and then loses half their deals in evaluation needs help with technical buyers, maybe a solutions engineer on the call earlier. A rep who reaches proposal as often as anyone and then stalls needs help with pricing conversations. If the whole team drops at the same stage, that's a process problem, and finding where deals get stuck in the pipeline is the better place to start.
Get your CRM in front of Claude
HubSpot makes a connector for Claude, listed as Anthropic verified in Claude's connector directory, that can search and update contacts, companies, deals, tickets and campaigns.[1] It runs on HubSpot's MCP server, which reads CRM objects and engagements such as calls, emails and meetings, with access scoped to each user's permissions.[2] That makes it a good fit for this question, since activity per deal is part of the picture.
Salesforce has its own connector for Claude too, made by Salesforce and currently in beta. Salesforce describes it as a way to ask about pipeline and reason across accounts and opportunities while honoring its security, permissions and governance.[3]

If you'd rather work from a file, export closed deals from the last four to six quarters with owner, amount, created date, close date, outcome, segment, lead source and discount, plus each deal's stage history. In HubSpot, the "Date entered" stage properties give you that history, though they need a certain plan and have to be turned on for each pipeline.[4] Upload the files to a Claude chat, and check Anthropic's current upload limits if they're large.[5]
With Contextflo
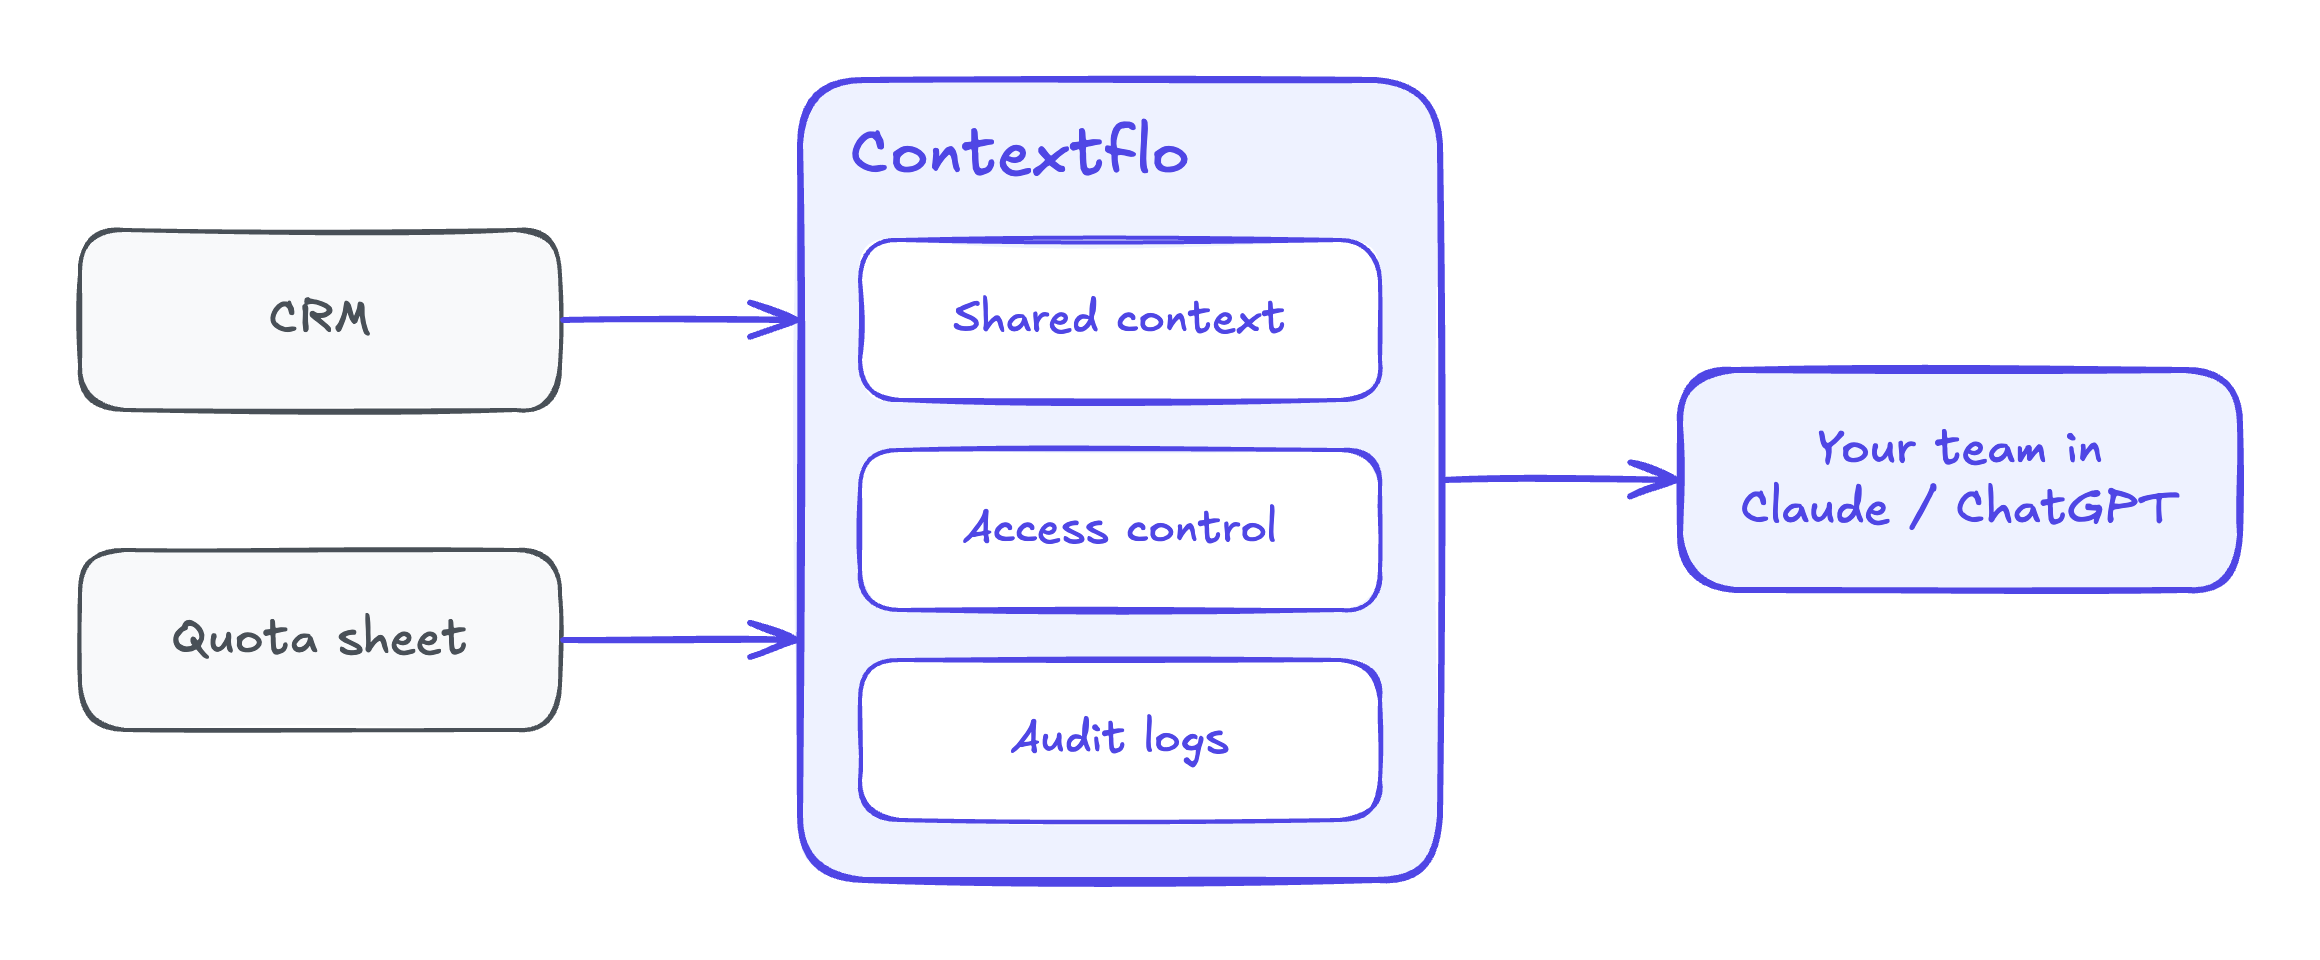
Connect HubSpot or Salesforce to Contextflo and the whole team can ask about rep performance in Claude, with the same definitions behind every answer. How win rate is calculated, whether expansions count, who gets credit for a reassigned deal, which segments and baselines each rep is measured against: you decide those once, and the sales lead, the founder and each rep see the same numbers. The CRM sits next to your other sources too, so the quota spreadsheet and meeting data from your calendar or call recorder can go into the same question.
Get in touch and we'll set up the CRM connection with you. Book 20 minutes.
Prompts worth pasting
Start with the whole picture per rep:
For deals closed won or closed lost in the last four quarters, show
each deal owner's deals won, deals lost, win rate (won / (won + lost)),
median deal size, median days from created to closed won, and average
discount on won deals. Put the deal count next to every rate.
Then check how much of each rep's result came from outside their control:
For each owner, what share of closed-won amount came from their single
largest deal? What share of their won deals were created by someone
else or before they became the owner? Show attainment with and without
the largest deal.
Normalize against the team:
Calculate the team's win rate and median deal size for each combination
of segment and lead source over the last eight quarters. Then compare
each rep's win rate to the baseline for their own mix of deals, and
rank reps by how far above or below their baseline they are. Mark any
rep with fewer than 20 decided deals.
Find the stage to coach. This one needs stage history:
For each rep, of the deals they moved into each stage, what share
reached the next stage? Compare every rep's rate to the team rate for
the same stage and segment, and name the one stage where each rep
falls furthest below the team.
Bring in quota and meetings from other tools:
Join closed deals to our quota sheet by rep and quarter, and to meeting
counts from the calendar data by rep. For each rep, show attainment,
meetings held per deal won, and win rate, and flag reps whose meetings
per win are more than 50% above the team median.
I'd ask for the counts every time. A rep at 60% on five deals looks like a star until the five is sitting next to it.
Worked example: five reps, one leaderboard
The reps and numbers here are illustrative. A B2B software team with five account executives looks at the last four quarters. Every full-year quota is $500,000, and Lena, who joined mid-year, has a prorated $250,000.
| Rep | Segment | Attainment | Won / lost | Win rate | Avg deal | Median cycle | Self-sourced pipeline | Avg discount |
|---|---|---|---|---|---|---|---|---|
| Marcus | Enterprise | 131% | 11 / 34 | 24% | $59,500 | 96 days | 25% | 18% |
| Priya | Mid-market | 108% | 22 / 38 | 37% | $24,500 | 48 days | 30% | 9% |
| Dana | Mid-market | 96% | 20 / 30 | 40% | $24,000 | 52 days | 70% | 7% |
| Tom | SMB | 86% | 26 / 44 | 37% | $16,500 | 21 days | 15% | 22% |
| Lena | Mid-market | 73% | 7 / 11 | 39% | $26,000 | 45 days | 40% | 10% |
On the leaderboard, Marcus is the clear number one. The deeper view reads differently.
Marcus's year includes one $210,000 deal, a third of his bookings. Without it he's at 89%. Six of his eleven wins came from pipeline inherited from a rep who left in the spring. His 24% win rate is barely above the team's usual 22% for enterprise, and he gave the second-deepest discounts on the team. He's a solid enterprise rep who had a good year.
Dana is the one to learn from. Seventy percent of her pipeline was outbound she created herself, and she won 13 of 35 outbound deals, 37%, against a team baseline of 26% for outbound mid-market. Priya's higher attainment rests mostly on inbound demo requests, where she won at about the team's usual rate. Both are good. Only one of them is doing something the rest of the team isn't.
Tom closes at the SMB average but gives away 22% on the average deal, twice the team's typical discount. Lena's 7 of 18 is too thin to judge either way. What stands out is how few deals she had, so the question for her is where her next quarter's deals come from.
Then the coaching view. By stage, Marcus moved 38% of his enterprise deals from evaluation to proposal, against 61% for the team's enterprise deals over the prior two years. He gets meetings and loses them once a technical buyer joins. The team's fix was pairing him with a solutions engineer from the first evaluation call.
So the leaderboard said Marcus, Priya, Dana. The fuller picture said Dana's outbound approach is what to spread, Tom's discounting needs a floor, Lena needs pipeline, and Marcus needs help in one stage. That's also the view that makes calling which deals will close this quarter more honest, since you know whose commits to trust.
FAQ
How do you measure sales rep performance fairly? Look at several numbers together instead of quota attainment alone: win rate, average deal size, sales cycle length, how much pipeline the rep created versus inherited, discounting, and how accurate their forecast calls were. Then compare each rep against the team's results for the same segment and lead source, because an enterprise rep working outbound and an SMB rep working inbound demo requests aren't playing the same game.
How do I calculate win rate per sales rep? Divide deals won by deals won plus deals lost, counting only deals that reached a decision in the period and leaving open deals out. Group by deal owner. For coaching, also calculate it from each stage: of the deals a rep moved into evaluation, how many were won? That shows where in the process a rep's deals are lost.
Why is quota attainment a bad way to rank sales reps? Because it mixes the rep's skill with things the rep didn't control. Territory, lead quality, pipeline inherited from someone who left, the mix of deal sizes and a single large deal can each move attainment more than selling does. Attainment is still the number the business runs on, so keep it, but read it next to win rate, deal size and self-sourced pipeline before deciding who is strong.
How many deals do you need to compare reps? There's no fixed number, but a win rate built on a dozen decided deals can swing by 20 points on a couple of outcomes. Put the deal count next to every rate, compare over several quarters rather than one, and treat a rep with few decided deals as too early to call rather than as weak or strong.
Can Claude compare sales rep performance from HubSpot or Salesforce? Yes. HubSpot and Salesforce each offer a connector for Claude, and you can also export closed deals with owner, stage history, amount and dates and upload the files. Ask for win rate, deal size and cycle length by deal owner, split by segment and lead source, with the deal count next to every number.
Find out if Contextflo is the right fit for you.
See how teams use Contextflo

Related posts

Keep reading
Conversational analytics: 5 ways to set it up, compared
7 min read
How to connect Claude to BigQuery (and fix the errors you'll hit)
8 min read
How to connect Claude to Postgres (and keep it read-only)
7 min read

How to build a BI dashboard with Claude that your team can actually trust
8 min read

How to give Claude read-only access to your database (it isn't always the default)
7 min read

You connected your warehouse to Claude, now what?
5 min read
Why we built our own Postgres MCP server
7 min read

What should go in the board deck this month? How to pull metrics from HubSpot and Stripe with AI
7 min read

Which closed deals churned within a year? How to connect HubSpot and Stripe with AI
8 min read