Where are deals getting stuck? How to spot pipeline bottlenecks in Salesforce with AI
Hi, this is Vivek, building Contextflo. I share practical notes on getting answers from your data, a couple of times a month.
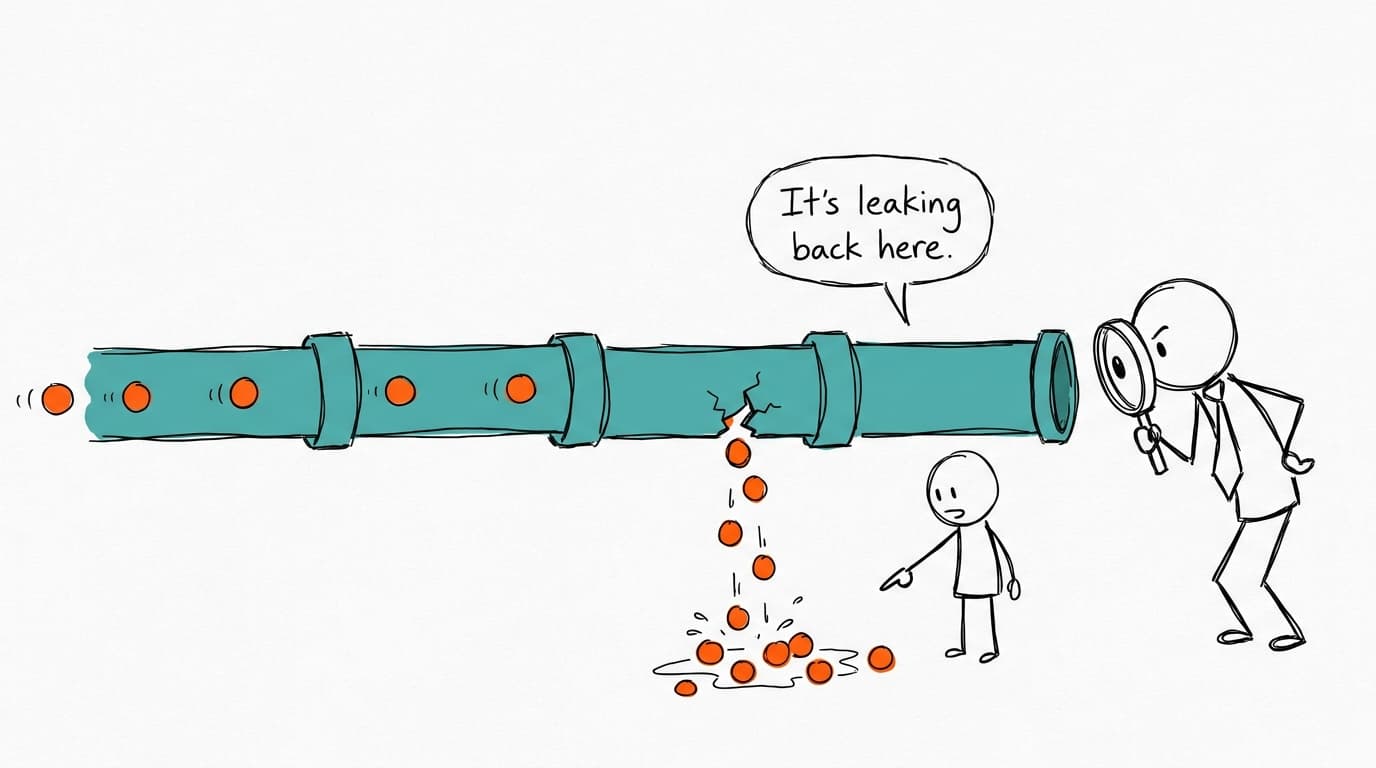
Deals get stuck at the stage where your pipeline either slows down or drops out, and those are two different problems. Pull the history of every opportunity's stage changes, then for each stage measure how many deals move to the next one and how long they sit first. The stage with the steepest drop is leaking. The stage where time runs far past your won deals is stalling. Split both numbers by segment, rep and lead source, and you'll usually find the bottleneck is one stage for one kind of deal.
Is the stage slow, or is it leaking?
People say "deals are stuck in proposal" about two different situations.
A slow stage keeps deals too long, but most of them come out the other side. Security reviews, legal redlines and procurement queues do this. Win rate looks fine, the cycle is just long, and the quarter slips because deals land a month late.
A leaky stage loses deals. They close lost there, or they go quiet and get closed out in a cleanup three months later. Often something upstream let in deals that were never going to buy, or the step itself isn't working. A demo that doesn't land, or a proposal priced for a buyer you weren't talking to.
The fixes pull in opposite directions. Speeding up a leaky stage just gets you to the loss sooner, and tightening qualification on a slow stage throws away deals you'd have won. So measure both, stage by stage, and keep them apart.
How to find the bottleneck, step by step
- Pick a window of deals, not a snapshot. Take every opportunity that entered your first stage over the last four quarters. Today's open pipeline tells you where deals are, not where they've been.
- Rebuild each deal's path from its stage history: the stages it entered, when, and where it ended.
- For each stage, count deals that entered it and deals that reached the next stage (or closed won). That ratio is the stage-to-stage conversion.
- For each stage, take the median days spent there, separately for deals that eventually won and deals that lost.
- Count skipped stages as passed through. A deal that jumped from discovery straight to proposal still got past evaluation. Leave it out and evaluation looks worse than it is.
- Treat long-idle open deals as losses for this exercise. A deal that's sat in proposal for three times the won-deal median is effectively lost, even if nobody has closed it.
Leave the last few weeks out of the window. Deals that entered a stage recently haven't had time to move, and they'll make that stage look like a wall.
Split it before you believe it
A funnel that looks fine overall can hide one broken corner. Run the same two numbers by:
- Segment or deal size. Enterprise deals spend longer everywhere, so a blended median makes SMB look slow and enterprise look fast.
- Rep. If one rep's evaluation-to-proposal rate is half everyone else's, start with a coaching conversation before touching the process.
- Lead source. Inbound demo requests and outbound meetings often convert at very different rates in the first stage, then look similar after that.
- New business versus expansion. Expansions skip stages all the time, and mixing them in inflates conversion.
Keep the groups big enough to mean something. Seven deals in a stage is an anecdote.
When the stage names stop meaning the same thing
Stage definitions drift. "Proposal" was a sent quote two years ago, and now half the team moves a deal there after a good call. When that happens, conversion out of proposal falls and nobody changed how they sell. They changed how they click.
Two checks catch most of it. Compare stage conversion by quarter and look for a step change that lines up with a new hire, a new sales manager or a renamed stage. Then look at what's attached to deals entering the stage. If only half the deals entering proposal have a quote, the stage means two things now.
Skipped stages are the other signal. Some skipping is normal, like an expansion that goes straight to proposal. A lot of skipping into negotiation tends to mean the stage before it has turned into paperwork nobody bothers with, and it's worth asking whether that stage still earns its place.
Getting Salesforce data in front of Claude
Salesforce keeps a history of each opportunity's stage changes, along with changes to amount and close date, so the raw material for all of this is already in your org.
The most direct route is Salesforce's own connector for Claude. It's listed in Claude's connector directory, made by Salesforce and currently in beta. Salesforce describes it as a way to ask about pipeline and reason across accounts and opportunities, grounded in real Salesforce data, while honoring Salesforce security, permissions and governance.[1] For a sales lead who wants to ask about this quarter's open pipeline without leaving the chat, that's a good start, and it respects the permissions your admin already set up.

If you'd rather work from a file, export your opportunities with created date, close date, amount, stage, owner, segment, lead source and type, plus the stage history for each one, and upload both to a Claude chat. Check Anthropic's current upload limits if the export is large.[2]
With Contextflo
Connect Salesforce to Contextflo and the whole team can ask about the pipeline in Claude, with the same stage definitions behind every answer. You decide once what counts as a skipped stage, which window to measure, how long an idle deal can sit before it counts as lost, and how segments are cut. After that the sales lead, the founder and RevOps all see the same funnel, and the rep comparison doesn't turn into an argument about whose numbers are right. Salesforce sits next to your other data too, so a leaky first stage can be checked against where those leads came from in marketing.
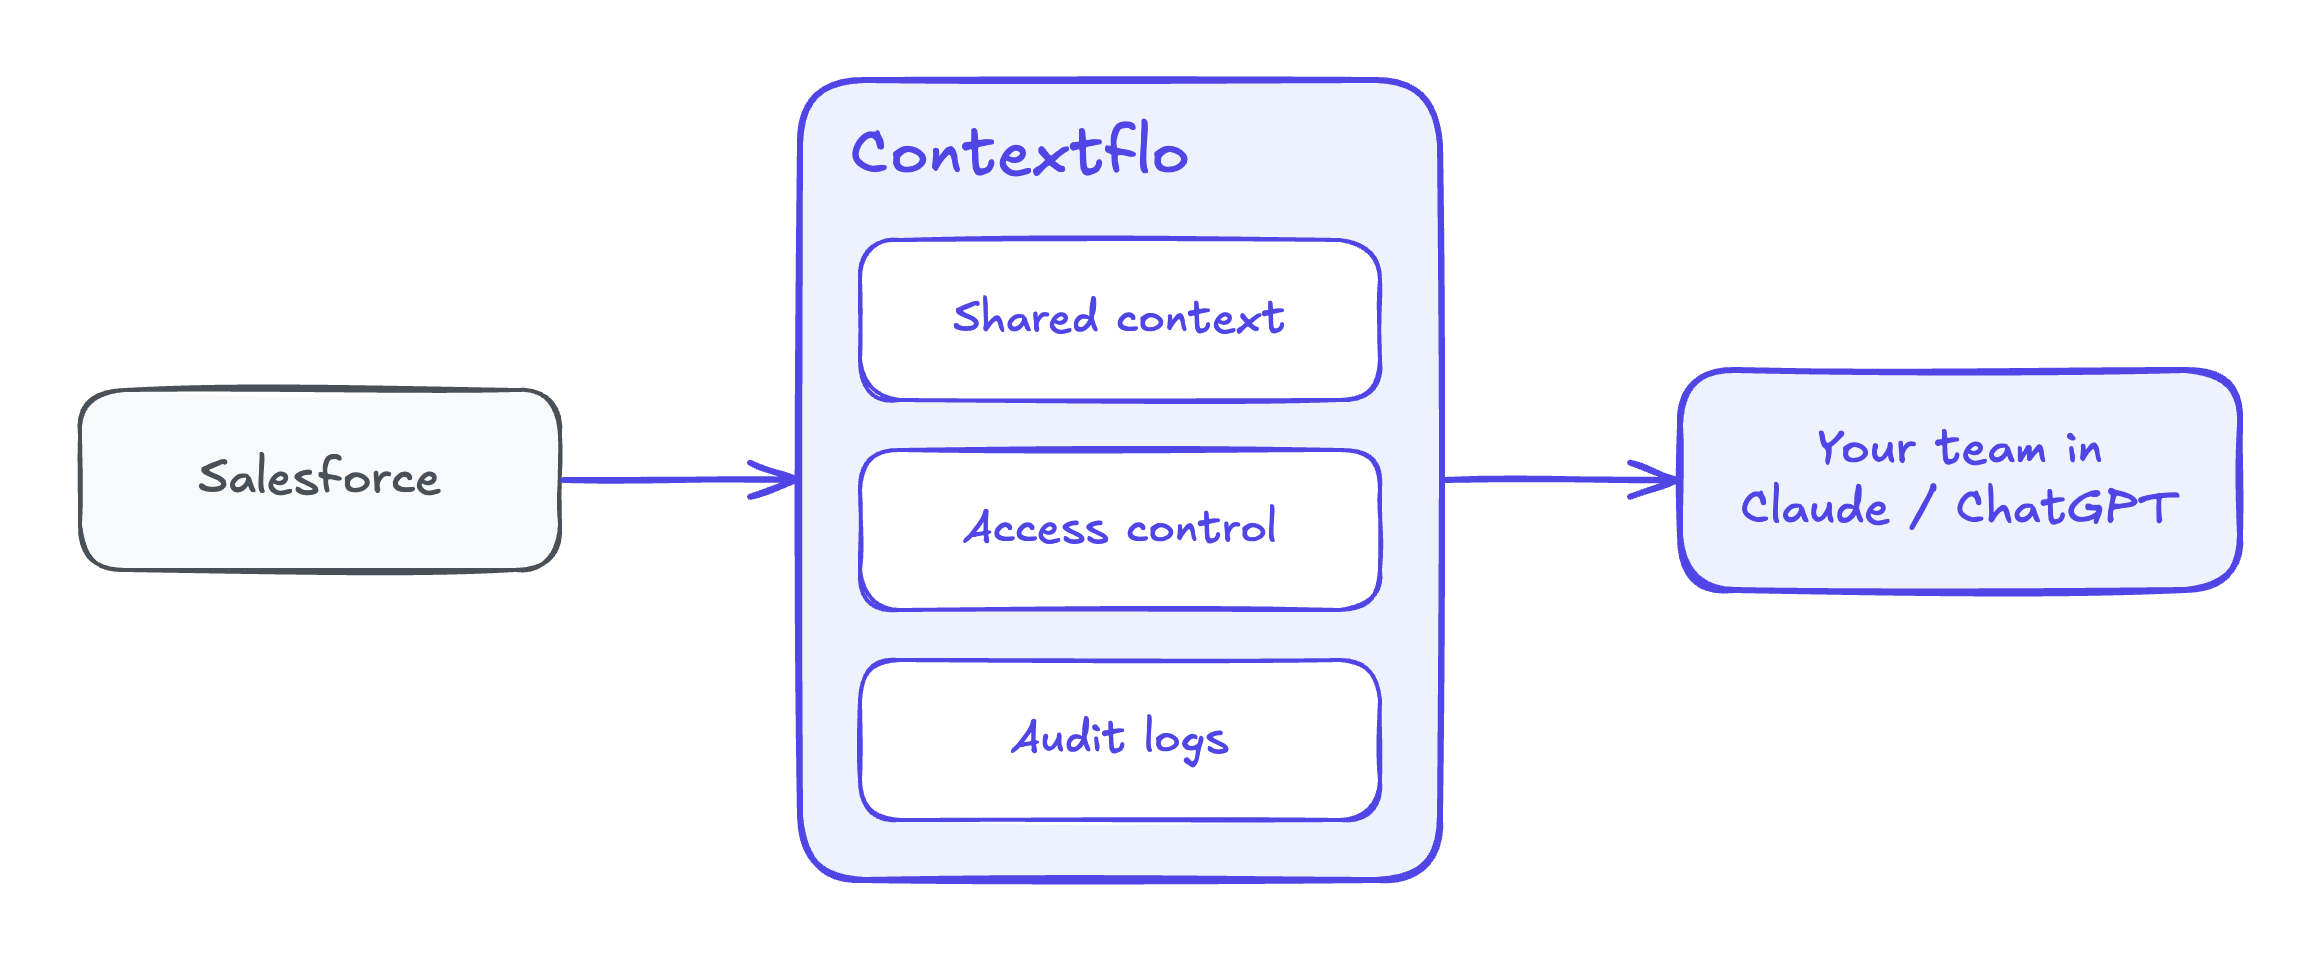
Get in touch and we'll set up the Salesforce connection with you. Book 20 minutes.
Prompts to paste into Claude
These start broad and narrow down. The middle ones need stage history, and the last one brings in a second source.
The funnel itself:
For opportunities that entered the first stage in the last four
quarters, show each stage with: deals that entered it, deals that
reached the next stage or closed won, the conversion rate, and median
days in the stage for won and lost deals separately. Count skipped
stages as passed through. Exclude deals created in the last 30 days.
Is it slow or leaky:
For each stage, what share of deals that entered it closed lost or went
90 days with no stage change? Rank stages by that share, and separately
by how far the median days in stage runs past the won-deal median.
Where the split hides it:
Repeat the stage conversion table split by segment and by lead source.
Mark any cell with fewer than 20 deals. Which stage has the biggest gap
between the best and worst segment?
For the evaluation stage only, show conversion to the next stage and
median days in stage for each rep with at least 20 deals entering it.
Drift and skipping:
Show conversion out of each stage by quarter for the last six quarters.
Flag any quarter-over-quarter change of more than 10 points. Then list
how often deals skipped each stage, by quarter, and by type (new
business or expansion).
With marketing data alongside it:
Match the Salesforce opportunities to our marketing lead data by lead
source and campaign. For deals that closed lost in discovery, which
campaigns did they come from, and how does that compare to deals that
made it past discovery?
I'd always ask for the counts next to every rate. A 50% conversion on four deals will jump out once the four is sitting beside it.
Worked example: a funnel that looked fine
The numbers here are illustrative. A B2B software team has a pipeline with five stages. Over the last four quarters, 400 opportunities entered discovery.
| Stage | Entered | Moved on | Conversion | Median days, won deals | Median days, lost deals |
|---|---|---|---|---|---|
| Discovery | 400 | 220 | 55% | 9 | 21 |
| Evaluation | 220 | 176 | 80% | 16 | 34 |
| Proposal | 176 | 88 | 50% | 11 | 38 |
| Negotiation | 88 | 70 | 80% | 24 | 29 |
| Closed won | 70 |
Overall, 400 deals in, 70 won, a 17.5% win rate. The sales lead's guess was negotiation, because that's where deals feel stuck. The data says negotiation is slow, 24 days for won deals, but 80% of what gets there closes. Deals wait there, and then they sign.
Proposal is the leak. Half the deals that reach it never make it out, and the lost ones sit there for over five weeks first. Split by segment, the picture sharpens:
- Mid-market proposals converted at 68%.
- SMB proposals converted at 31%, and most of those losses cited price.
Split by rep, every rep showed the same SMB gap. And quarter by quarter, proposal conversion dropped from 62% to 44% two quarters ago, right when the team started moving deals to proposal after the first demo instead of after a pricing call.
So the fix is putting the pricing conversation back before proposal for SMB deals. Pushing legal to move faster in negotiation would barely register. If SMB proposal conversion rose to about 54%, still well under mid-market, around 20 more deals a year would reach negotiation, and at 80% from there that's roughly 16 more wins on the same 400 deals in.
That bottleneck was invisible in the win rate and in the stage everyone complained about. It showed up the moment someone asked where deals leave, not just where they wait. Once you know which deals leak, sorting this quarter's open deals by risk and forecasting what the pipeline will actually produce both get easier.
FAQ
How do I find where deals get stuck in my pipeline? Measure two things for every stage: the share of deals that move on to the next stage, and how long they spend in the stage first. Build both from deals that entered each stage over the last few quarters, not from today's open pipeline. The stage with the biggest drop in conversion is where deals leak, and the stage where time runs well past your winning deals is where they stall. Then split both by segment, rep and lead source to see whether the problem is everywhere or in one corner.
How do I calculate stage conversion rates in Salesforce? For each stage, count the opportunities that entered it in a period, then count how many of those later reached the next stage or closed won. Salesforce keeps a history of each opportunity's stage changes, so you can see every stage a deal passed through, not just where it sits now. Count deals that skipped a stage as having passed through it, or the stage they skipped will look better than it is.
What's the difference between a slow stage and a leaky stage? A slow stage holds deals longer than it should, but most of them eventually move on. A leaky stage loses deals: they close lost or go quiet there. Slow stages tend to need a process fix such as faster approvals, while leaky stages often point to deals being qualified in too early or a step that isn't landing with buyers. A stage can be both, and the fix differs, so measure time and conversion separately.
Can Claude analyze my Salesforce pipeline? Yes. Salesforce offers its own connector for Claude, currently in beta, that lets Claude work with opportunities, accounts and other Salesforce data under your existing permissions. You can also export an opportunity report with stage history and upload it. Ask for stage-to-stage conversion and median days in stage, split by segment, rep and source.
Find out if Contextflo is the right fit for you.
See how teams use Contextflo
Related posts
Keep reading
Conversational analytics: 5 ways to set it up, compared
7 min read
How to connect Claude to BigQuery (and fix the errors you'll hit)
8 min read
How to connect Claude to Postgres (and keep it read-only)
7 min read
How to build a BI dashboard with Claude that your team can actually trust
8 min read
How to give Claude read-only access to your database (it isn't always the default)
7 min read

You connected your warehouse to Claude, now what?
5 min read
Why we built our own Postgres MCP server
7 min read

What should go in the board deck this month? How to pull metrics from HubSpot and Stripe with AI
7 min read

Which closed deals churned within a year? How to connect HubSpot and Stripe with AI
8 min read