Is your pipeline forecast right? How to forecast revenue from HubSpot or Salesforce with AI
Hi, this is Vivek, building Contextflo. I share practical notes on getting answers from your data, a couple of times a month.
A pipeline forecast is right when it's built from what your deals actually did, not from what reps say they'll do. Take the deals open at the start of the quarter, apply the share that historically closed from each stage within a quarter, add what you usually win from deals created mid-quarter, and adjust for how often close dates slip. Then run the same method on last quarter's starting pipeline and compare it to what closed. If it would have been close, you have a number you can defend. If it wouldn't, you found that out before the board did.
Why the called number misses
Most small B2B teams forecast one of two ways: reps call their deals and a manager rolls it up, or the CRM multiplies each deal by a stage probability. Both lean on inputs nobody checks.
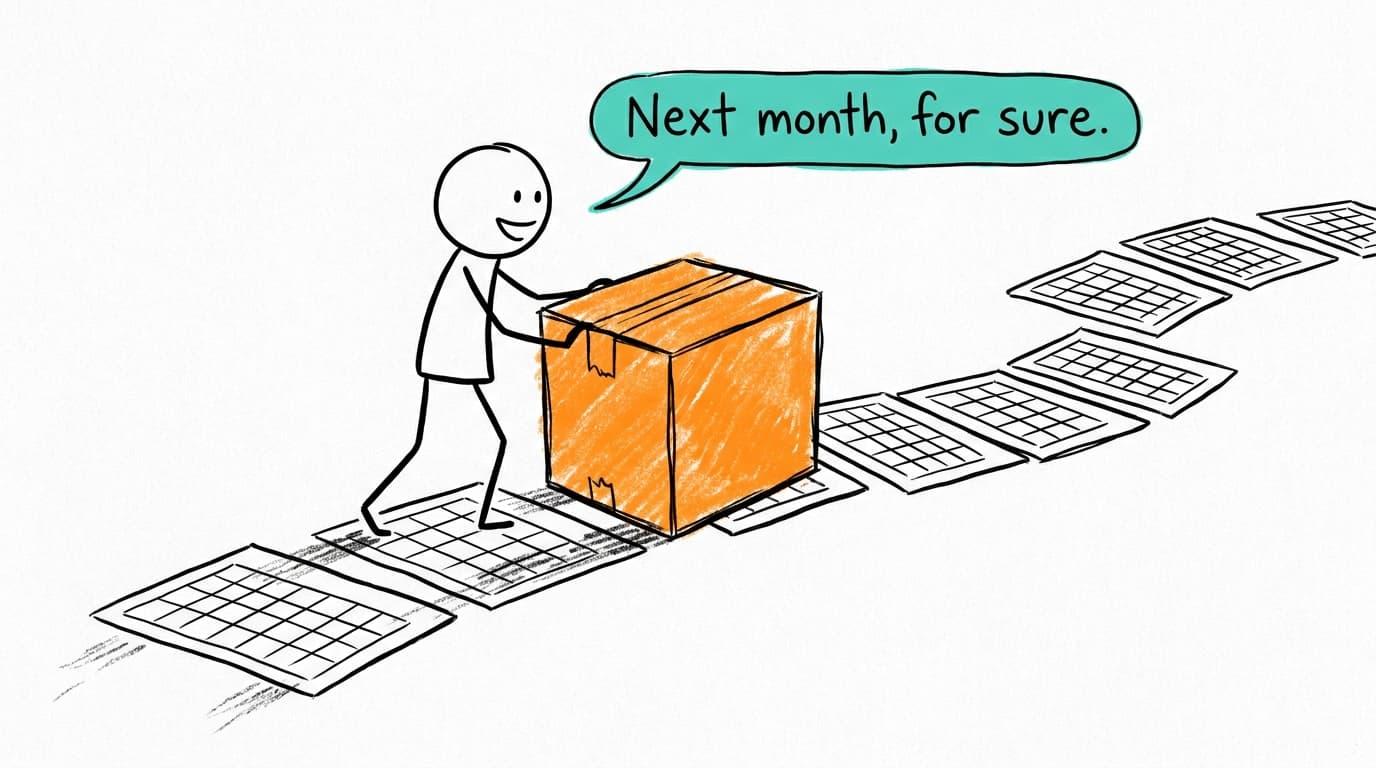
- Close dates go stale. A rep sets a close date at the first call and moves it when the quarter ends. Until then, the deal counts toward a quarter it won't close in.
- Commits are negotiated. Some reps sandbag to beat their number, others stay optimistic to protect their pipeline. The rollup inherits both, and they don't cancel out reliably.
- Stages drift. "Proposal" meant a sent quote two years ago and now means a promising call. The 60% probability attached to it hasn't moved.
- Old deals never leave. A deal that has sat in evaluation for three times your normal cycle still carries its full stage weight.
None of this is anyone lying. The inputs are opinions, and a forecast built from opinions is only as good as the most optimistic one.
What history gives you instead
Your CRM already records what deals did. A few measures from past deals replace the guesses.
| Measure | What it answers | Where it comes from |
|---|---|---|
| Stage-to-close rate | Of deals sitting in this stage at the start of a quarter, what share closed won by quarter end? | Stage entry dates plus close outcome, from past quarters |
| Time in stage | How long do deals that eventually win spend in each stage? Anything far past that is stale | Stage entry and exit dates |
| Slippage | How often does a close date move later, and by how much? | The history of the close date field |
| Coverage | How much pipeline do you need to start with to hit a target? | Target divided by the historical share of starting pipeline that closes |
Split the rates by whatever changes how deals behave: segment, deal size, new business versus expansion, sometimes source. A mid-market deal in proposal and an SMB deal in proposal are different bets. Keep the cohorts big enough to mean something, though. Four quarters of deals is a reasonable floor for a small team, and a segment with eight deals in it is an anecdote.
Coverage also tells you where the problem is. If history says you need more pipeline than you have, the forecast can't fix that, and the next question is which channels create pipeline that closes. That's its own analysis.
Weighted pipeline versus historical conversion
Both multiply open pipeline by a percentage. Weighted pipeline uses a probability someone set per stage and applies it to every deal dated in the quarter. Historical conversion uses the rate your deals actually closed at from that stage within the quarter, which already absorbs slippage, stalled deals and losses. A stage probability of 60% against a historical rate of 40% is most of a forecast miss, sitting in one cell.
Making the number defensible
Leadership doesn't distrust forecasts because the math is hard. They distrust them because they can't see the math. Four habits fix most of that.
- Show the method in one line. "Open pipeline by stage, times last four quarters' in-quarter close rate by stage and segment, plus average in-quarter created-and-won."
- List the assumptions. Which quarters feed the rates, how stale deals were treated, what counts as a segment.
- Backtest it. Rebuild last quarter's forecast from last quarter's starting pipeline, using only rates available at the time, and put it next to actual bookings and next to the rep commit.
- Give a range. The backtest error across a few quarters is your honest plus or minus.
If I only had one slide, it would be the backtest. It answers "why should we believe this" before anyone asks.
The rep call still has a job. Reps know about the deal whose champion just left. Put the history number and the commit side by side, and spend the forecast meeting on the deals where they disagree.
The quick way: export your deals and ask Claude
You need closed and open deals with their stage history, not just today's snapshot.
- HubSpot deals. Export deals with amount, create date, close date, pipeline, deal stage and segment fields, plus the stage calculated properties: "Date entered" and "Date exited" for each stage, and "Cumulative time in" each stage.[1] They need a certain HubSpot plan tier, so check HubSpot's current plan requirements, and they're turned off for new pipelines and new stages by default. Turning them on fills values in retroactively from existing data.[2]
- HubSpot close date history. In property settings, export the history of the close date property across all deals, as CSV or XLSX. It goes one property at a time, and HubSpot only keeps a limited number of past revisions per property, so check HubSpot's current export limits before counting on the full history.[3]
- Salesforce. Export an opportunities report with stage, amount, created date, close date and type, plus a report on opportunity history, which records changes to stage, amount and close date over time.
- Upload the files to a Claude chat, or put them in a Google Sheet and link it through the Google Drive connector.[4][5]
Then ask:
Using deals closed in the last four quarters, for each quarter find the
deals that were open on the first day, and the stage each was in that day.
For each stage and segment, what share closed won by the end of that
quarter? Show counts next to the rates.
From the close date history, what share of deals had their close date
pushed at least once, and what was the median push in days? Which open
deals have been in their current stage longer than 90% of deals that won?
Backtest: rebuild last quarter's forecast from the pipeline open on its
first day, using rates from the four quarters before it only. Compare
it to actual closed-won and to the CRM's weighted pipeline for that date.
Where the quick way strains
Claude caps how many files a chat can hold and how large each one can be, so check Anthropic's current upload limits, though size usually isn't the problem.[4] Reconstructing "what was open on day one" from stage dates is fiddly, so check a handful of deals by hand before trusting the rates. HubSpot's revision cap can cut off the oldest close date changes on a deal that's been pushed a lot. And Claude derives the method fresh in each chat, so next quarter's backtest may quietly use a different rule for stale deals.
Keep the exports where Contextflo can reach them
Upload the deal and close-date exports to Contextflo once, or connect the Sheet you keep them in, and Claude or ChatGPT can read them directly from then on, alongside your warehouse if the CRM already syncs there.
What matters for a forecast is saving the method: how "open on day one" is defined, the stale-deal rule, the segment definitions. Next quarter's backtest then runs on the same rules instead of a new guess.
Share that with the team, and whoever runs next quarter's backtest gets the same method you used, not a different rule for stale deals.
Once it's a weekly forecast call, use a warehouse
Exporting every week gets old. Fivetran and Airbyte both sync HubSpot and Salesforce into BigQuery, Snowflake or Postgres on a schedule.[6][7][8][9]
One catch: a sync gives you current values unless history is kept somewhere. Fivetran's history mode records every version of a record, but only from the moment you switch it on, and for Salesforce it can miss changes that happen between syncs.[10] Turn it on, or save a weekly snapshot of open pipeline, well before you need a year of slippage data.
Then point Claude at the warehouse directly, as in Claude with BigQuery, or through Contextflo so the forecast method is one saved definition the whole team uses.
Worked example: three forecasts for one quarter
These numbers are made up for illustration. A B2B software company with a $400,000 Q4 target starts the quarter with $1.2M of pipeline set to close in Q4.
| Stage on Oct 1 | Pipeline | CRM probability | Weighted | Historical in-quarter close rate | History-based |
|---|---|---|---|---|---|
| Discovery | $500,000 | 20% | $100,000 | 8% | $40,000 |
| Evaluation | $400,000 | 40% | $160,000 | 20% | $80,000 |
| Proposal | $200,000 | 60% | $120,000 | 40% | $80,000 |
| Negotiation | $100,000 | 80% | $80,000 | 60% | $60,000 |
| Created and won in-quarter | 4-quarter average | $70,000 | |||
| Total | $1,200,000 | $460,000 | $330,000 |
Reps commit $520,000, weighted pipeline says $460,000, history says $330,000. Much of the spread is slippage: over the last four quarters, 45% of deals dated in the quarter had their close date pushed at least once, by a median of five weeks. Weighted pipeline counts all of them at face value.
Which number goes to leadership? The backtest decides:
| Q3 forecast, made July 1 | Forecast | Actual Q3 bookings | Error |
|---|---|---|---|
| Rep commit | $480,000 | $295,000 | +63% |
| CRM weighted pipeline | $430,000 | $295,000 | +46% |
| History-based | $310,000 | $295,000 | +5% |
In the three quarters before that, the history method landed within about 12% each time. So the forecast that goes up is $330,000, a range of roughly $290,000 to $370,000, and one plain line: the $400,000 target needs about $70,000 more than this pipeline will likely produce.
A $520,000 commit would have hidden that gap until December. The history number shows it on October 1, with a quarter left to do something about it.
FAQ
How do I forecast revenue from my sales pipeline? Take the open deals expected to close this quarter and, for each stage, multiply their value by the share of deals that historically closed from that stage within the quarter. Add what you normally win from deals created and closed inside the same quarter. Those historical rates come from your own past deals in HubSpot or Salesforce, not from the default stage probabilities.
Why is my weighted pipeline forecast always too high? Weighted pipeline multiplies each deal by a stage probability that someone picked once and nobody checked, and it takes every close date at face value. When a large share of deals slip past their close date, the weighted number counts revenue that lands next quarter or never. Comparing stage probabilities to your actual stage-to-close rates usually shows the gap.
What is a good pipeline coverage ratio? There's no universal number. Coverage should come from your own win rates: if history says about a quarter of the pipeline you start with closes inside the quarter, you need roughly four times your target in pipeline, not the three times people often quote. Work it out from your last four quarters.
How do I track deal slippage in HubSpot? Slippage means a deal's close date moved later. HubSpot keeps past values of each property, and you can export a property's history across all records from the property settings, one property at a time, as CSV or XLSX. Export the close date history for deals, then count how often and how far close dates moved. HubSpot only keeps a limited number of past revisions per deal property, so check HubSpot's current property history limits before assuming you have the full record.
Can Claude forecast revenue from HubSpot or Salesforce data? Claude can do the math if you give it deal history: closed and open deals with stage, amount, close date and create date, plus when each deal entered each stage. Upload the exports or link a Google Sheet, ask for stage-to-close rates by segment, then have it backtest the method on last quarter before you trust it for this one.
Find out if Contextflo is the right fit for you.
See how teams use Contextflo

Related posts

Keep reading
Conversational analytics: 5 ways to set it up, compared
7 min read
How to connect Claude to BigQuery (and fix the errors you'll hit)
8 min read
How to connect Claude to Postgres (and keep it read-only)
7 min read

How to build a BI dashboard with Claude that your team can actually trust
8 min read
How to give Claude read-only access to your database (it isn't always the default)
7 min read

You connected your warehouse to Claude, now what?
5 min read
Why we built our own Postgres MCP server
7 min read

What should go in the board deck this month? How to pull metrics from HubSpot and Stripe with AI
7 min read

Which closed deals churned within a year? How to connect HubSpot and Stripe with AI
8 min read