Which customers are about to churn? How to spot churn risk with AI
Hi, this is Vivek, building Contextflo. I share practical notes on getting answers from your data, a couple of times a month.
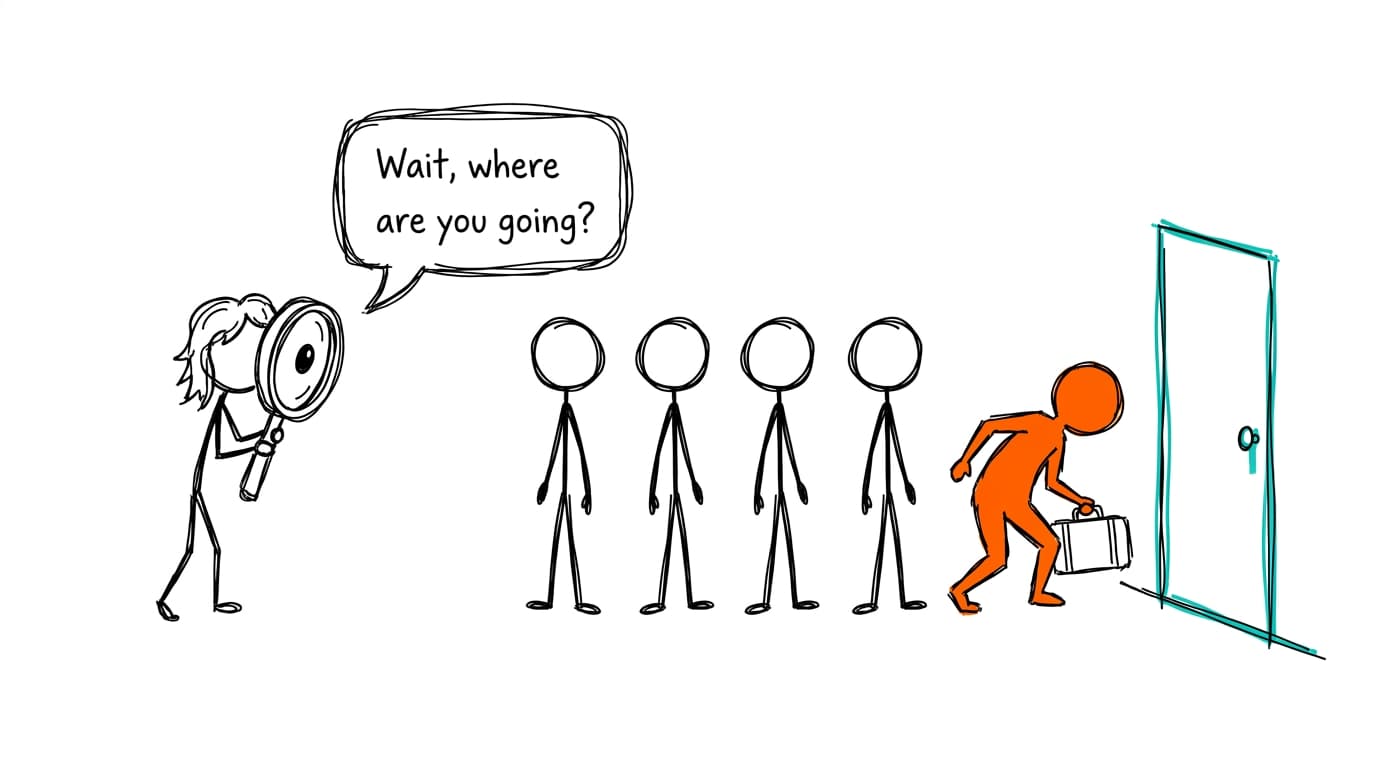
The customers about to churn are usually the ones whose behavior already changed. Their usage dropped against their own normal, fewer seats log in, a feature they relied on went quiet, a card failed, or the person who bought you left. You find them by looking backward first: take the accounts that churned last quarter, see what they had in common two to three months before they left, turn that into a few flags, and count those flags on every account you have today. Then check the flags against a quarter where you already know who left. A short list you've tested beats a health score nobody has.
The signals that actually come before churn
Churn is decided well before the cancellation email. These are the changes that tend to show up first, roughly in the order a small SaaS team can measure them.
- Usage falling against the account's own baseline. Compare each account's last four weeks with its previous eight. A small account that always logs in twice a week is fine; a large one that went from daily to twice a week is not. A single threshold for everyone misses this.
- Fewer active seats. Paid seats stay flat until renewal. Active seats move first.
- A key feature abandoned. Most products have one feature that means "this is part of how we work": the report someone exports every Monday, the integration that syncs nightly. When it stops, pay attention.
- Billing trouble. In Stripe, a subscription goes
past_duewhen payment on the latest invoice failed or wasn't attempted, and a customer who clicked cancel often shows up ascancel_at_period_endset to true while still active.[1][2] Downgrades and removed seats belong here too. - Support gets loud, or goes silent. A burst of tickets means friction. An account that used to file tickets and stopped may have stopped caring.
- The champion left. The admin who set you up hasn't logged in for a month, or their email bounces.
- Renewal is close. On its own it's just a date. Combined with any of the above, it's when the decision gets made.
Why the health score in your CS tool misses
Most customer success tools ship a health score, and most small teams trust it more than it deserves. The weights were picked by someone during onboarding, say 30% NPS, 30% tickets, 40% logins, and nobody has checked them against who actually left. The inputs are whatever the tool could see, which often means no product usage at all, or a login count synced once a week from a field someone set up two years ago.
The check is simple. Pull the score each account had at the start of last quarter and see how many of that quarter's churners were red. If most of them were green, the score is describing something, just not churn.
Build churn flags from the accounts you already lost
A model is tempting. With a few hundred accounts and twenty-odd churners a quarter, it has very little to learn from, and "the model says so" is a hard sell to the account manager making the call. I'd start with rules:
- Define churn in one sentence. For example: subscription canceled, or recurring revenue down more than half, within the quarter. Decide now whether a downgrade counts, because it changes everything downstream.
- Take last quarter's churners and a comparison group of accounts that stayed, ideally similar in size.
- Look at both groups 60 to 90 days before the quarter started. Not at the moment of cancellation, when the answer is obvious and too late.
- Keep the three to five differences that separate them most. If 70% of churners had usage down 40% and only 10% of retained accounts did, that's a flag. If both groups look the same, drop it, however sensible it sounds.
- Rank current accounts by how many flags they carry, then by revenue and renewal date.
- Backtest before you trust it. Build the flags from the quarter before last, freeze them, apply them as of the first day of last quarter, and count how many of last quarter's churners they would have caught.
That last step is what makes the list worth acting on. It's the same discipline as backtesting a pipeline forecast: run the method on a period where you already know the answer.
The quick way: three exports and a Claude chat
You need three things, each keyed by something you can match across them, usually a customer ID or company domain.
- Usage per account per week. If you have product analytics, export weekly active users and key feature events by account. If usage lives in your app database, someone runs one query: account ID, week, active users, and a count of the key feature.
- Stripe subscriptions and invoices. Export them from the Dashboard as CSV, with status, plan, amount,
cancel_at_period_end, and invoice payment status. - CRM accounts. Renewal date, owner, main contact, and ticket counts by month if your support tool exports them.
Upload the files to a Claude chat, or put them in a Google Sheet and link it through the Drive connector, keeping in mind Claude caps how many files a chat can hold and how large each one can be, so check Anthropic's current upload limits before a big export.[3][4] Then ask:
Churn means a subscription canceled or MRR down more than 50% during Q1.
Match these files on customer ID and show me any rows that don't match.
For accounts that churned in Q1 and accounts that didn't, compare the
state they were in during the 90 days before January 1: usage trend vs
their own prior 8 weeks, active seats, weekly use of the export feature,
past_due invoices, support tickets. Show counts next to percentages.
Pick the 3 to 5 differences that best separate churned from retained
accounts. Turn each into a yes/no flag with an exact threshold. Then,
using only data up to April 1, count flags for every account and tell me
how many Q2 churners had 2 or more.
Apply the same flags to data as of today. List accounts with 2 or more
flags, sorted by flag count, then ARR, with renewal date and owner.
Where this breaks down
Matching is where most of the time goes. The Stripe customer, the CRM account and the product workspace rarely share one ID, and a fuzzy match on company name quietly drops accounts, so check the unmatched rows before reading anything else. A usage export is also a snapshot: if you only kept the current month, you can't see what an account looked like 90 days before it left. And Claude works out the flag thresholds again in every chat, so next month's list may use slightly different rules unless you paste them in.
Where Contextflo fits
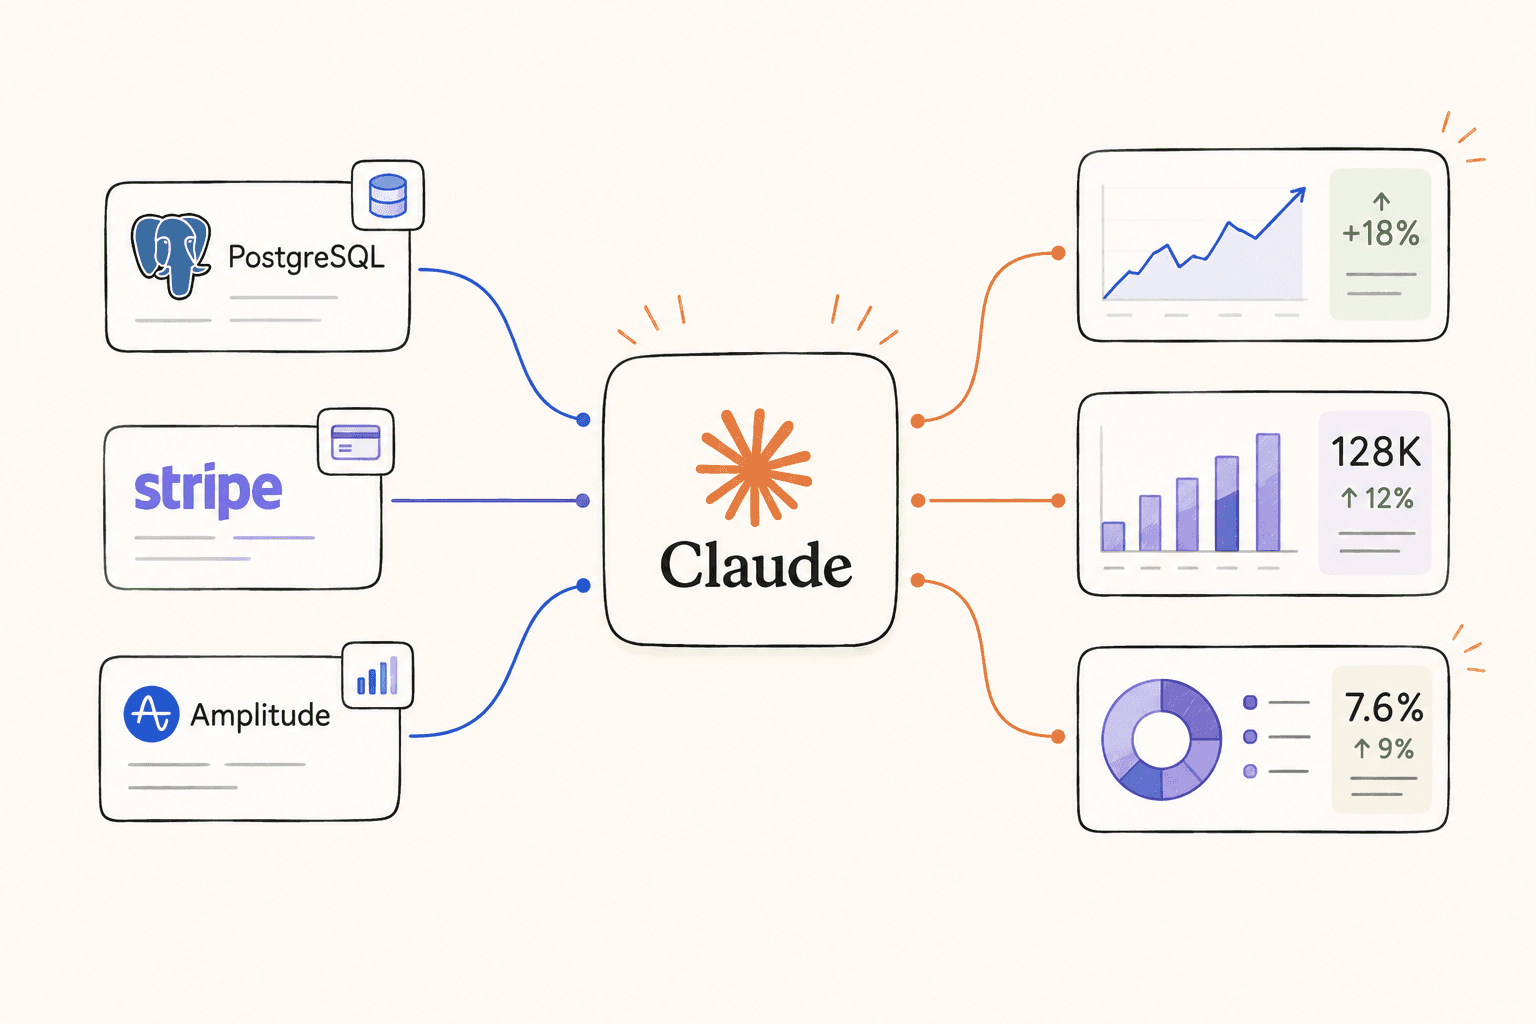
Product usage often lives in your app's Postgres database or a warehouse, and Contextflo connects to those directly, read-only, so the usage side stays current without an export. Setup is covered in Claude with Postgres. Upload the Stripe and CRM exports next to it, or connect the Google Sheet you keep them in, and Claude or ChatGPT can read all of it together from then on.
The piece that pays off is saving the flags. Tell the agent that "usage down 40% against the prior 8 weeks" is a churn flag, and next month's list uses the same definition, and so does the account manager who asks about one customer.
Share that setup with the team, and everyone pulling the churn list gets the same flags, built the same way, instead of a different rule each time someone starts a new chat.
The full setup: billing and CRM next to product data
If churn review becomes a monthly habit, put everything in one place. Fivetran and Airbyte both sync Stripe, including subscriptions, invoices and customers, into BigQuery, Snowflake or Postgres on a schedule, and both have HubSpot and Salesforce sources for the CRM side.[5][6] Load them into the warehouse that holds your product events, or replicate the app database there too.
Then the flags are one SQL query joining usage, billing and CRM, and the history is kept for you. Point Claude at the warehouse directly, or go through Contextflo so the churn definition and flags are saved once for the whole team.
Worked example: flags from Q1, tested on Q2
The numbers here are made up for illustration. A B2B SaaS company with 400 accounts builds flags from its Q1 churners, looking at the 90 days before January 1.
| Candidate signal | Q1 churners | Retained | Kept? |
|---|---|---|---|
| Weekly active users down 40%+ vs own prior 8 weeks | 72% | 11% | Yes |
| Export feature unused for 30 days | 56% | 15% | Yes |
| Invoice past due in the last 60 days | 28% | 3% | Yes |
| Main admin inactive 30+ days | 22% | 2% | Yes |
| No support tickets in 90 days | 39% | 34% | No |
Ticket silence sounded like a good signal and didn't separate anything, so it's out. The four flags are frozen and applied to every account as of April 1. Then the team waits for Q2 to close and counts.
| Flags on April 1 | Accounts | Churned in Q2 | Churn rate |
|---|---|---|---|
| 0 | 290 | 3 | 1% |
| 1 | 76 | 4 | 5% |
| 2 or more | 34 | 12 | 35% |
| All | 400 | 19 | 4.8% |
The 34 accounts with two or more flags held 12 of the 19 churners, about 63%, at seven times the base churn rate. For comparison, the CS tool had 41 accounts marked red on April 1, and 6 of them churned.
Today, 27 accounts carry two or more flags. The team sorts them by ARR, pulls the ones renewing in the next 90 days, and each owner gets a call list with the reason attached: usage down by half, export stopped in August. The seven Q2 churners the flags missed get a look of their own, since whatever they had in common is next quarter's fifth flag.
FAQ
How do I know which customers are going to churn? Look at the accounts that already churned and find what they had in common 60 to 90 days before they left: usage falling against their own baseline, fewer active seats, a key feature dropped, failed payments, a champion leaving. Turn the three to five patterns that separate churners from retained accounts into flags, count the flags on every current account, and work the list from the top.
What are the early warning signs of customer churn in SaaS? The reliable ones show up in data you already have. Weekly usage down sharply compared with the account's own past weeks, active seats shrinking, a core feature going unused, a subscription set to cancel at period end or sitting past due in Stripe, a downgrade, the main contact leaving, and a renewal date coming up while any of those are true. Support tickets help too, both a spike and a sudden silence.
Why doesn't our customer health score predict churn? Health scores are usually weighted by hand once and never checked against who actually churned. They often lean on inputs the CS tool can see, like NPS and ticket counts, while product usage is missing or stale. Check yours by pulling the score as it stood a quarter ago and seeing how many of last quarter's churners were flagged.
Can Claude predict customer churn? Claude can do the analysis if you give it the data: weekly usage per account, subscriptions and invoices from Stripe, and accounts from your CRM. Ask it to compare churned and retained accounts before they left, build a few flags, and backtest them on last quarter. It won't have a trained model behind it, and for most small SaaS companies a few checked rules are the better start anyway.
Do I need machine learning to predict churn? Usually not at first. With a few hundred accounts and a couple of dozen churners a quarter, a model has little to learn from and is hard to explain to the person making the save call. A handful of flags built from past churners, backtested on a quarter you already know the answer to, gets most small teams further, faster.
Find out if Contextflo is the right fit for you.
See how teams use Contextflo

Related posts
Keep reading
Conversational analytics: 5 ways to set it up, compared
7 min read
How to connect Claude to BigQuery (and fix the errors you'll hit)
8 min read
How to connect Claude to Postgres (and keep it read-only)
7 min read
How to build a BI dashboard with Claude that your team can actually trust
8 min read
How to give Claude read-only access to your database (it isn't always the default)
7 min read
You connected your warehouse to Claude, now what?
5 min read
Why is the team missing sprint goals? How to analyze Jira data with AI
8 min read
Are my ads actually profitable? How to analyze Facebook and TikTok ads together with AI
7 min read
Still building the weekly KPI report by hand? How to automate it with Claude
7 min read