Is your retention improving? How to run a cohort analysis with AI, no SQL
Hi, this is Vivek, building Contextflo. I share practical notes on getting answers from your data, a couple of times a month.
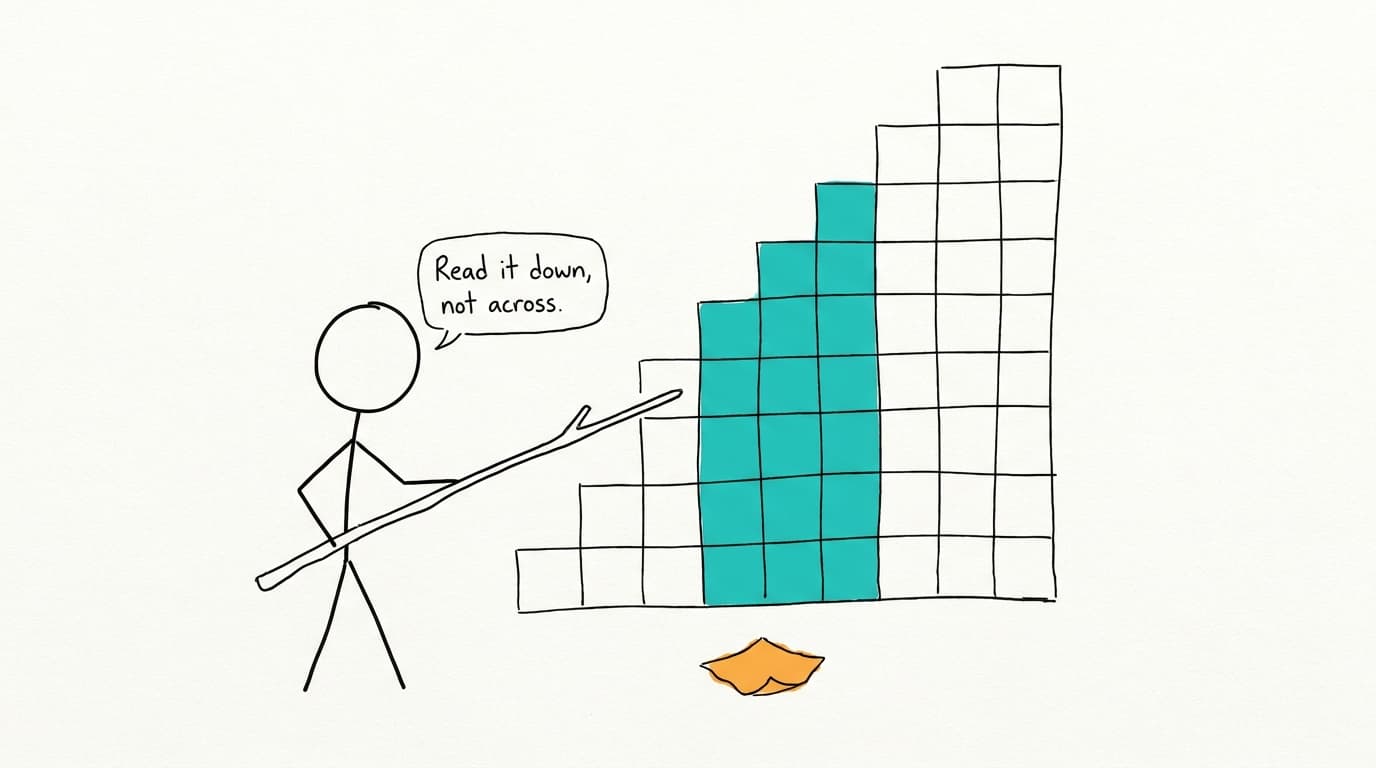
To tell whether retention is improving, don't watch the overall churn rate. Group customers by the month they signed up or first bought, then compare what share of each group is still around at the same age: month 1, month 3, month 6. If the March cohort kept 54% at month 3 and the April cohort kept 62%, retention improved, whatever the blended churn number did. That grid is a cohort table. You can build one from a Stripe or Shopify export in a Claude chat without writing SQL, as long as you check how it counted.
How to read a cohort table
Here's a small one, with made-up numbers. Each row is a cohort, the customers whose first month was that month. Each column is months since that first month. Each cell is the share of the cohort still active, meaning they paid or purchased in that month.
| First month | Customers | Month 0 | Month 1 | Month 2 | Month 3 |
|---|---|---|---|---|---|
| January | 200 | 100% | 64% | 52% | 47% |
| February | 180 | 100% | 62% | 50% | 46% |
| March | 240 | 100% | 66% | 55% | |
| April | 260 | 100% | 74% |
Read across a row and you see one cohort decay: January lost 36% in its first month, then the losses slowed. Read down a column and you compare cohorts at the same age, which is the question you actually care about. April's month 1 is 74% against 62% to 66% for the three cohorts before it. Something changed.
The empty cells aren't missing data. April customers haven't been around for two full months yet. That triangle shape is normal, and it's also where the most common mistake hides (more on that below).
Customers kept or revenue kept?
A cohort table can count heads or dollars, and they answer different questions.
Logo retention counts customers. It tells you whether people keep finding the product worth paying for. Net revenue retention (NRR) counts recurring revenue from the same group of customers, so upgrades push it up and downgrades push it down, along with churn.
Logo retention = customers from the cohort still active in month N
                 / customers in the cohort at the start

NRR = (starting MRR + expansion - contraction - churned MRR)
      / starting MRR
A cohort that started at $10,000 MRR, lost $1,500 to cancellations, $500 to downgrades and gained $2,500 in upgrades has NRR of ($10,000 + $2,500 - $500 - $1,500) / $10,000 = 105%. It lost customers and still pays you more. For a SaaS company selling to businesses, both numbers matter: logo retention says whether the product sticks, NRR says whether the accounts that stay grow.
For a store, the revenue version is usually revenue per original customer by month since first purchase, which is the start of a lifetime value curve.
Mistakes that make retention look better or worse than it is
Most bad cohort tables are wrong in one of these ways, and none of them throw an error.
| Mistake | What it does | Fix |
|---|---|---|
| Mixing calendar months with months since start | "March" means a signup month in one place and a calendar month in another, and the table compares unlike things | Rows are first month, columns are months since, always |
| Counting the current partial month | The latest column looks like a cliff because the month isn't over | Only count completed months |
| Test and internal accounts | Your team's free accounts inflate early cohorts, or churn in a batch and deflate them | Exclude by email domain, a flag, or zero-price plans |
| Reactivations | A customer who canceled and came back either vanishes or shows up twice | Decide once: count them active in the months they pay, in their original cohort |
| Small cohorts | 30 customers can swing 10 points on a few people | Show the cohort size next to every row |
| Reading the latest cohorts too early | A cohort still filling up, or only partly through month 3, gets compared with finished ones | Compare cohorts only at ages every customer in them has fully reached |
The last one is survivorship, and it catches people who compute "average retention at month 3" over whichever customers happen to have month-3 data. Those customers are the ones who signed up earliest, and often the keenest. Stick to full cohorts that have all reached the column you're comparing.
So is it actually improving?
Pick one column that matters for your business and read it down. I'd default to month 3 for monthly subscriptions, because early churn from people who were only trying you out is mostly done by then. For annual plans, look at renewal: the share of each yearly cohort still paying at month 13.
Then ignore the blended churn rate for this question. New customers churn fastest, so when you grow, more of your base is new, and the overall rate can rise while every new cohort holds better than the last. The reverse also happens: a quiet quarter with few signups makes churn look healthier than it is.
If cohort sizes are small, look for a run of three or four cohorts moving the same way rather than one good month.
A cohort table tells you whether retention is getting better. It won't tell you which accounts are about to leave next month; that needs account-level signals, covered in which customers are about to churn.
For stores: repeat purchase cohorts
In e-commerce there's no subscription to cancel, so "retained" means bought again. Group customers by the month of their first order and fill the cells with the share who placed another order in each later month, or cumulatively by that month. Cumulative is easier to read for most stores, since people rarely buy every month. A useful companion row is revenue per original customer to date, which is where repeat purchases show up as money. If orders fell and you're wondering whether repeat buyers are the reason, why did my sales drop walks through that split.
The quick way: export, then ask Claude
You need one row per order or per payment, with a customer identifier and a date.
- Shopify. Export orders as CSV. It includes
Email,Name(the order number),Financial Status,Created at,TotalandRefunded Amount. Orders with several line items take several rows, so ask Claude to collapse to one row per order first.[1] - Stripe. Export subscriptions and invoices from the Dashboard as CSV, with customer, plan, amount, status and the start and cancellation dates. Paid invoices per month give you both logo and revenue retention.
- Your app database, if "active" means using the product rather than paying. One query from whoever has access: user ID, signup date, and the months they were active.
Upload the files to a Claude chat, or put them in a Google Sheet and link it through the Drive connector, keeping in mind Claude caps how many files a chat can hold and how large each one can be, so check Anthropic's current upload limits before a big export.[2][3] Then:
Build a monthly cohort retention table from this orders file. Collapse
it to one row per order first. A customer's cohort is the month of their
first paid order. Columns are months since that first month, 0 to 6.
A customer counts as retained in a month if they placed a paid order that
month. Exclude orders from @ourstore.com emails and the current month.
Show the cohort size on each row.
Before I trust this: list the steps you took, or the SQL you'd use for
the same table. Then pick 5 customers from the March cohort and show
their orders and which cells they were counted in.
Now show the same table as revenue per original customer, cumulative.
Then compare month-3 retention across cohorts and tell me whether it's
improving, with cohort sizes, not just percentages.
The second prompt is the one that matters. Claude will happily build the table either way, and the counting rules are where it goes wrong.
What breaks
Customer identity is the usual problem. A guest checkout under a different email, or a Stripe customer created twice for one company, splits one customer into two cohorts. Claude also makes the counting decisions again each chat, so next month's table may treat reactivations differently unless you paste in the rules you settled on. And a Stripe or Shopify export is a snapshot you have to pull again every month.
Where Contextflo fits
If "active" comes from product usage, it probably lives in your app's Postgres database or a warehouse. Contextflo connects to those directly, read-only, so the table reads current data instead of last month's export. Setup is in Claude with Postgres. Upload the Stripe and Shopify exports next to it, or connect the Google Sheet you keep them in, and Claude or ChatGPT can read all of it together.
The useful part for cohorts is saving the definition once: what counts as active, which accounts are excluded (test and internal accounts, for instance), how reactivations are handled. Next month's table and the board deck use the same rules.
Share those definitions with the team, and whoever pulls the cohort table next gets the same rows counted the same way, not a fresh set of decisions each chat.
The full setup for a monthly board number
When retention goes in a board deck every month, stop exporting. Fivetran and Airbyte both sync Stripe and Shopify into BigQuery, Snowflake or Postgres on a schedule.[4][5][6][7] Then the cohort table is one query. Here's a starting point for repeat purchase cohorts, in Postgres, against an orders table with a customer ID, a timestamp and a paid status. Rename the columns to match what your sync creates.
WITH first_orders AS (
  SELECT customer_id, date_trunc('month', MIN(created_at)) AS cohort_month
  FROM orders
  WHERE financial_status = 'paid'
  GROUP BY customer_id
),
activity AS (
  SELECT DISTINCT o.customer_id, f.cohort_month,
    (EXTRACT(YEAR FROM age(date_trunc('month', o.created_at), f.cohort_month)) * 12
     + EXTRACT(MONTH FROM age(date_trunc('month', o.created_at), f.cohort_month)))::int
     AS months_since
  FROM orders o
  JOIN first_orders f USING (customer_id)
  WHERE o.financial_status = 'paid'
    AND o.created_at < date_trunc('month', now())  -- completed months only
)
SELECT cohort_month, months_since, COUNT(*) AS customers,
  ROUND(100.0 * COUNT(*) / MAX(COUNT(*)) OVER (PARTITION BY cohort_month), 1) AS pct
FROM activity
GROUP BY cohort_month, months_since
ORDER BY cohort_month, months_since;
It still needs your test-account exclusions. Point Claude at the warehouse directly, as in Claude with BigQuery, or through Contextflo so the query is saved once and everyone asking about retention gets the same answer.
Worked example: churn went up, retention got better
The numbers are made up for illustration. A subscription software company changed its onboarding in April. By August, the founder is worried: monthly churn rose from 6.1% in March to 7.4% in July. The cohort table, built with only completed months:
| First month | Customers | Month 1 | Month 2 | Month 3 |
|---|---|---|---|---|
| January | 120 | 70% | 58% | 51% |
| February | 110 | 68% | 57% | 50% |
| March | 136 | 71% | 60% | 54% |
| April | 210 | 78% | 68% | 62% |
| May | 260 | 80% | 70% | |
| June | 300 | 79% |
March first showed 150 customers. Fourteen were internal test accounts from a QA push, and removing them moved March's month-3 figure by three points. Everything else was fine as exported.
Month 3 went from around 51% for the pre-change cohorts to 62% for April. May and June are tracking the same way at months 1 and 2. The onboarding change worked.
So why did churn go up? Signups more than doubled between February and June. In July, more than half of active customers were in their first three months, which is exactly when customers leave most. A larger, younger base churns at a higher blended rate, even when each cohort holds better than the last.
Revenue tells a similar story. April's month-3 revenue retention is 71%, above its 62% logo retention, because the customers who stayed moved to bigger plans.
The founder's board slide drops the blended churn line and shows the month-3 column instead, with cohort sizes next to it. It's a less alarming chart, and the more accurate one.
FAQ
How do I do a cohort retention analysis without SQL? Export your customers and orders, or your subscriptions, as CSV from Shopify or Stripe. Upload them to a Claude chat or put them in a Google Sheet, then ask Claude to group customers by the month of their first purchase or signup and show what share were still active 1, 2 and 3 months later. Ask it to show the steps or the SQL it used, and check a few customers by hand before you trust the table.
How do I read a cohort retention table? Each row is a group of customers who started in the same month. Each column is months since they started, so month 0 is always 100%. Read across a row to see how one cohort decays. Read down a column to compare cohorts at the same age, which is how you tell whether retention is getting better.
What is the difference between logo retention and net revenue retention? Logo retention counts customers: of the customers you had at the start, how many are still paying. Net revenue retention counts money: the recurring revenue those same customers pay now, including upgrades and minus downgrades and churn, divided by what they paid at the start. NRR can be above 100% even while you lose customers, if the ones who stay expand.
Why does my churn rate go up when my cohorts look better? New customers churn fastest in their first few months. If you're growing, a bigger share of your base is new, so the overall churn rate rises even when each new cohort holds on better than the last. Compare month-3 retention across cohorts instead of watching the blended rate.
Find out if Contextflo is the right fit for you.
See how teams use Contextflo

Related posts


Keep reading
Conversational analytics: 5 ways to set it up, compared
7 min read
How to connect Claude to BigQuery (and fix the errors you'll hit)
8 min read

How to connect Claude to Postgres (and keep it read-only)
7 min read

How to build a BI dashboard with Claude that your team can actually trust
8 min read

How to give Claude read-only access to your database (it isn't always the default)
7 min read

You connected your warehouse to Claude, now what?
5 min read

Why is the team missing sprint goals? How to analyze Jira data with AI
8 min read

Are my ads actually profitable? How to analyze Facebook and TikTok ads together with AI
7 min read
Still building the weekly KPI report by hand? How to automate it with Claude
7 min read