How franchises compare performance across 50+ locations
Hi, this is Vivek, building Contextflo. I share practical notes on getting answers from your data, a couple of times a month.
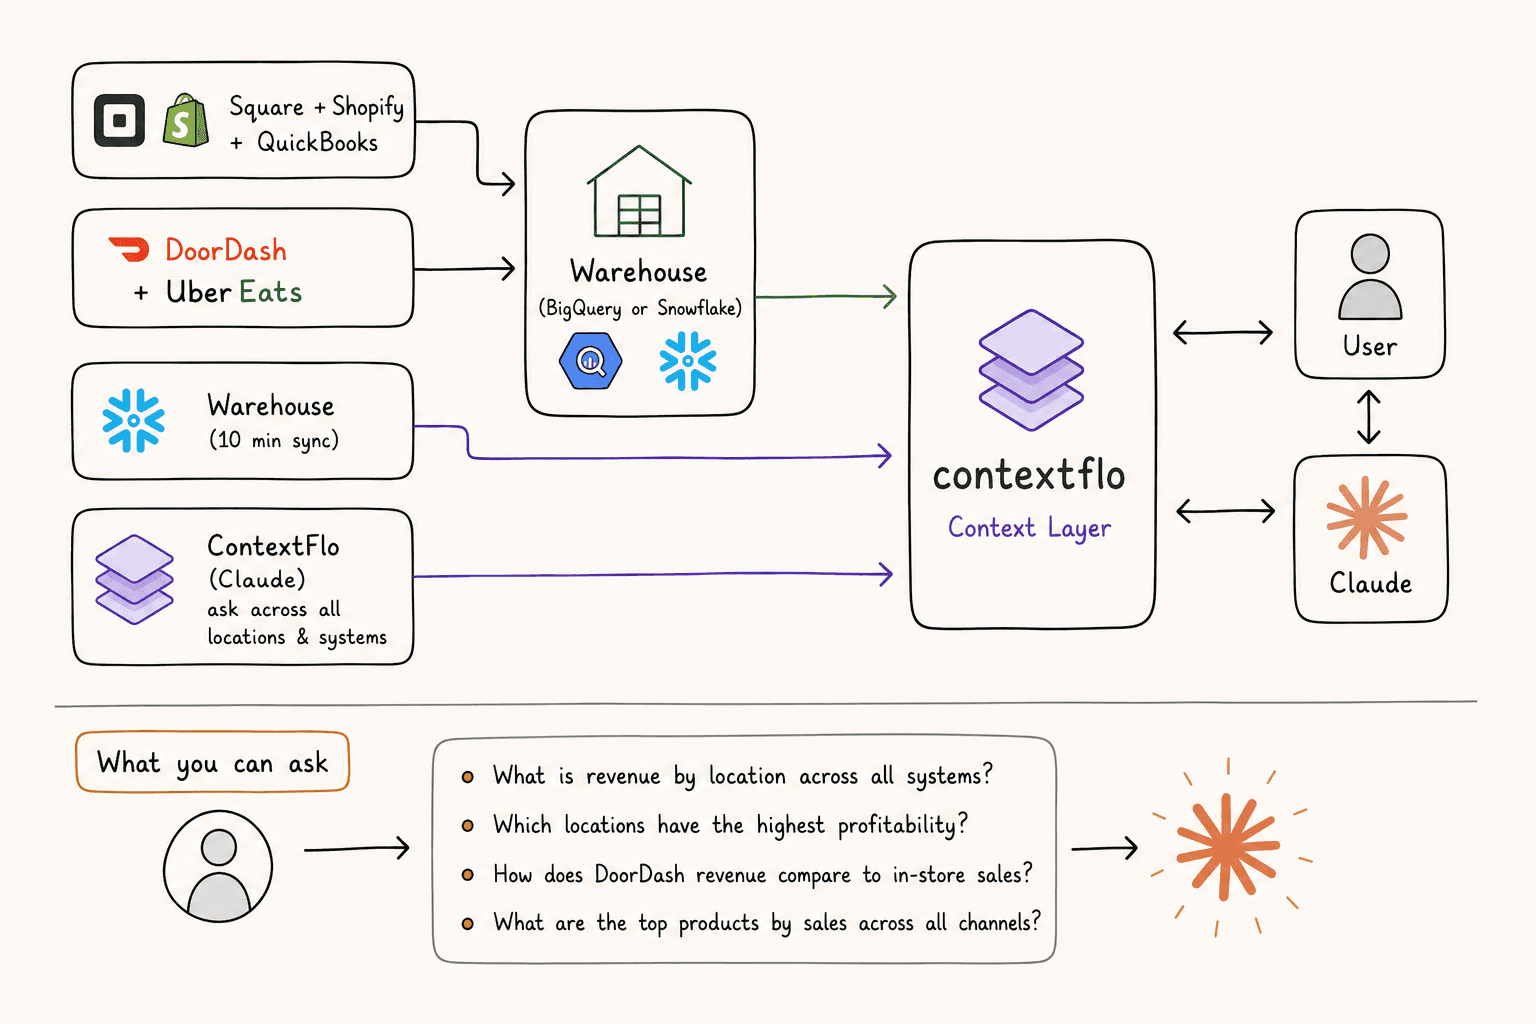
Fifty locations. Same brand, same menu, same operations playbook. And the data sits in Square, 7shifts, QuickBooks and DoorDash, siloed per location, so comparing performance means exporting from every system for every location and stitching it together by hand.

The problem
A multi-location business runs on four to six systems per location:
- POS: Square, Toast, Lightspeed for sales, orders and menu mix
- Labor: 7shifts, Deputy for scheduling, labor cost and overtime
- Delivery: DoorDash, UberEats for volume, commissions and ratings
- Reviews: Google Business Profile for sentiment by location
- Accounting: QuickBooks, Xero for P&L per location
Each reports on one location at a time. Any cross-location question, which is to say every question an operations lead actually has, means either a corporate BI platform costing months and real money, or somebody pulling fifty reports by hand.
The result is that most multi-location operators know their worst location is bad roughly a month after it started being bad.
The setup
- Square + 7shifts + QuickBooks → Airbyte or Fivetran → warehouse
- DoorDash + UberEats → same pipeline, same warehouse
- Warehouse → Contextflo
- Contextflo → Claude
The one thing that decides whether this works is a location identifier on every row, consistent across every system. Get that wrong and nothing downstream can be compared.
This is genuinely the hard part, and it is worth doing before anything else. Square calls it a location ID, 7shifts has its own, QuickBooks probably has a class or a department, and DoorDash has a store ID that someone in operations set up in a hurry three years ago. Build one mapping table from your internal location code to each system's identifier and keep it maintained. Every question in this post depends on it.
What you can ask once it is connected
Which locations have labor cost above 30% of revenue this month, and how does their overtime compare?
Compare food cost as a percentage of revenue across our top ten and bottom ten locations by sales. What's different?
Which locations have the highest DoorDash commission as a share of delivery revenue?
Show me locations where Google review ratings dropped below 4.0 this quarter alongside their sales trend.
The second one is the question worth building this for. Everyone knows which locations are underperforming. The useful part is what the good ones are doing differently, and that is a question nobody can answer from fifty separate dashboards.
Comparing locations fairly
A ranked list of locations by any metric will be dominated by things the location cannot control: a downtown store with high rent and high volume will not look like a suburban one, and a location that opened in March has no seasonal history.
Two habits fix most of this. Compare like with like, by segmenting on format, market type or age before ranking. And compare a location against its own trend as well as against the group, because a store improving fast from a low base is a different conversation than one quietly sliding from a high one.
Worth saying to the managers involved, too. Cross-location visibility lands very differently depending on whether it reads as a leaderboard or as a way to find out what is working. The data does not decide that, you do.
From weekly reports to answers
Regional managers should not wait for a Monday report to learn which locations need attention. With this setup they ask and get an answer spanning POS, labor, delivery and reviews at once, which is not a query any of those systems could have answered alone.
Here is a more in-depth look at Contextflo and how it works.
What is Contextflo?
Contextflo is a governed context layer between your data and the AI your team already uses. Connect your warehouse once, and your team asks questions in their own Claude or ChatGPT. The model writes and runs the SQL; Contextflo supplies the definitions, the per-user access control, and the audit that make the answers trustworthy. Your data never moves, and you do not need a data team.
How it works
Your team queries in their own Claude or ChatGPT over MCP, so you bring any agent rather than a locked-in bot, and every answer comes back with the SQL shown and access enforced per user.
Find out if Contextflo is the right fit for you.
See how teams use Contextflo

Related posts
Keep reading
Conversational analytics: 5 ways to set it up, compared
7 min read
How to connect Claude to BigQuery? What works and what doesn't in 2026
8 min read
How to connect Claude to Postgres without giving it write access
7 min read

How to build a BI dashboard with Claude that your team can actually trust
8 min read
How to give Claude read-only access to your database (it isn't always the default)
7 min read

You connected your warehouse to Claude, now what?
5 min read
The official Postgres server for Claude is archived. Here's what to use instead.
7 min read
Why is the team missing sprint goals? How to analyze Jira data with AI
8 min read
Are my ads actually profitable? How to analyze Facebook and TikTok ads together with AI
7 min read